

Disclaimer:
The authors are solely responsible for the content of this report. Material included herein does not represent the opinion of the European Community, and the European Community is not responsible for any use that might be made of it.
Back to overview reports
The supply of a certain service by a habitat can be multiplied by its surface to get a qualitative assessment of differences in ES supply. However, the surface-supply relationship is not the same for all habitats and services. Differences exist in the quantity of this relationship: e.g. one hectare of tidal flat will not supply the same ‘amount of benefit’ for nutrient capture as of sedimentation regulation. Also, surface-supply curves might be linear, exponential, or saturated: e.g. more deep water will increase navigation service, but after a certain amount is reached and demand is met, the service will not further increase. Therefore ES calculations based on surfaces should be interpreted as an indication and interpreted with caution.
The supply was calculated as relative surface proportion of each habitat (% to total zone surface, see section 5.1) times their service supply score (see section 5.2). A high service supply in a certain zone can thus be caused by a high surface proportion of a habitat and/or by a high supply score of this habitat.
The purpose of this section is to present the data in a way which enables direct comparison of supply over zones and estuaries per ES, as well as the relative contribution of each habitat. As stated in section 4.3 the surface relationship does not allow comparison of ES among each other, but informs us about the origin of differences in supply per ES among salinity zones.
In the Scheldt (Figure 29), provisioning services show a low supply in freshwater and oligohaline zones. However, food provision supply is very low (less than 1% of scale). Low scores for food provision, were attributed since high levels of pollution prevent consumption of fish and filter feeders from the estuary. However, historically as well as potentially, this supply could thus be higher than shown here.
The increase in supply scores of provision of water and regulating functions for water quantity, as well as the higher proportions of deep and moderately deep subtidal habitats towards the mouth provoke an increase in supply of these services, while decreases in most other regulation services (regulation of extreme events and water quality) and habitat services are observed. Supply by marsh habitat is very low in the polyhaline zone. This is caused by the low surface of this habitat, as the supply does not vary much (see section 5.2).
The same holds for tidal flat habitat in the oligohaline and freshwater zone, and shallow subtidal habitat in all zones. Supply scores are high (see section 5.2), but due to low relative surfaces, the contribution to overall ecosystem service delivery is relatively low.
In the Weser (Figure 31), the overall contribution of tidal flat habitat to ecosystem service supply is remarkably high in the mesohaline and polyhaline zone. This is caused by the high proportional surface and the relatively high potential supply scores of this habitat.
The same holds for marsh habitat in the freshwater and oligohaline zone. Provisioning services are quite equally supplied along the estuarine gradient. The supply of supporting services is high and also quite stable along the estuarine gradient.
Water quality regulation and regulation of disturbance services are doing less in the meso- and polyhaline zone, since the proportion of marsh habitat is very low.
In the Elbe (Figure 32), the contribution of marsh habitat to ES supply decreases towards the mouth in favor of tidal flat habitat, as can be seen from for instance climate regulation and flood water storage services. This decrease is mainly driven by the difference in relative surface.
Provisioning services, such as water for industrial use and water for navigation, are mainly supplied in fresh and oligohaline zone, as the port activities are located in the more upstream area. Supporting services are mainly provided by intertidal flats and marshes, while subtidal habitats are more important for provisioning and water quantity regulating services.
In the Humber (Figure 33), the very low proportion of tidal flats and even lower for marshes in fresh and oligohaline zones yields a clearly different picture for the Humber. In the fresh water zone, shallow subtidal habitats are very important, while the deeper habitats increase importance towards the mouth.
Back to top
How can public acceptance for management actions be increased?
How can the Ecosystem Services Approach be used to support management decisions?
How do TIDE estuaries deal with management problems?
How does habitat management affect the supply of ecosystem services?
How does the societal demand for ecosystem services vary along the estuary gradient?
What are the key areas of conflicts or synergies in TIDE estuaries?
What is important in establishing a zonation for estuaries?
Which aspects do I have to take into account in order to make a measure a success?
Which measures are suitable to achieve specific ecological targets?
Which measures are suitable to provide ecosystem services and benefits?
Which synergistic effects and conflicts can be expected by planning and implementing a certain measure?
“Working with nature”: What are the opportunities for sediment management in estuaries?
Ecosystem Service Assessment of TIDE Estuaries
Table of content
- 1. Summary
- 2. Introduction
- 2a. Ecosystem Services
- 2b. Ecosystem Services in Estuaries
- 2c. Key questions and general approach
- 3. TIDE ES - Assessment methodology
- 3a. From ES longlist to key ecosystem services
- 3b. Expert survey reliability: theory
- 3c. TIDE Survey methodology & reliability
- 4. Results: demand survey for ecosystem services in four EU estuaries
- 4a. Which are the key ecosystem services?
- 4b. Spatial aspects of ES demand
- 4c. Temporal aspects of ES demand
- 5. Supply of ecosystem services in four EU estuaries
- 5a. ES supply by habitats
- 5b. Determining conservation objectives with ES
- 5c. ES supply maps
- 5d. Functional ES supply
- 5e. Inter- and intra-estuarine ES supply patterns
- 5f. Habitat contributions to ES supply
- 6. Historical image of ES value
- 7. Trade-off risk assessment
- 8. Assessment of estuarine management measures
- 9. Ecosystem Services in TIDE: Conclusions
- 9a. Key question answers
- 9b. Future challenges
- 9c. Conclusion
- 10. Acknowledgements
- 11. References
Authors:
by Sander Jacobs, Wouter Vandenbruwaene, Dirk Vrebos, Olivier Beauchard, Annelies Boerema, Kirsten Wolfstein, Tom Maris, Sonja Saathoff and Patrick Meire
by Sander Jacobs, Wouter Vandenbruwaene, Dirk Vrebos, Olivier Beauchard, Annelies Boerema, Kirsten Wolfstein, Tom Maris, Sonja Saathoff and Patrick Meire
5e. Inter- and intra-estuarine ES supply patterns
The local supply of Ecosystem services of the four estuaries can be compared per zone. Surfaces of habitats as well as their importance/contribution to supply are different among estuaries and zones by multiplying the supply score and relative surface of a habitat yields a (non-dimensional) measure of ES supply for the zone. These measures can be compared between zones and estuaries. Relative surfaces were used since absolute surfaces reflect purely the divide in zones. Relative surfaces however reflect the existing equilibrium and habitat gradient.The supply of a certain service by a habitat can be multiplied by its surface to get a qualitative assessment of differences in ES supply. However, the surface-supply relationship is not the same for all habitats and services. Differences exist in the quantity of this relationship: e.g. one hectare of tidal flat will not supply the same ‘amount of benefit’ for nutrient capture as of sedimentation regulation. Also, surface-supply curves might be linear, exponential, or saturated: e.g. more deep water will increase navigation service, but after a certain amount is reached and demand is met, the service will not further increase. Therefore ES calculations based on surfaces should be interpreted as an indication and interpreted with caution.
The supply was calculated as relative surface proportion of each habitat (% to total zone surface, see section 5.1) times their service supply score (see section 5.2). A high service supply in a certain zone can thus be caused by a high surface proportion of a habitat and/or by a high supply score of this habitat.
The purpose of this section is to present the data in a way which enables direct comparison of supply over zones and estuaries per ES, as well as the relative contribution of each habitat. As stated in section 4.3 the surface relationship does not allow comparison of ES among each other, but informs us about the origin of differences in supply per ES among salinity zones.
Scheldt

Weser

Elbe
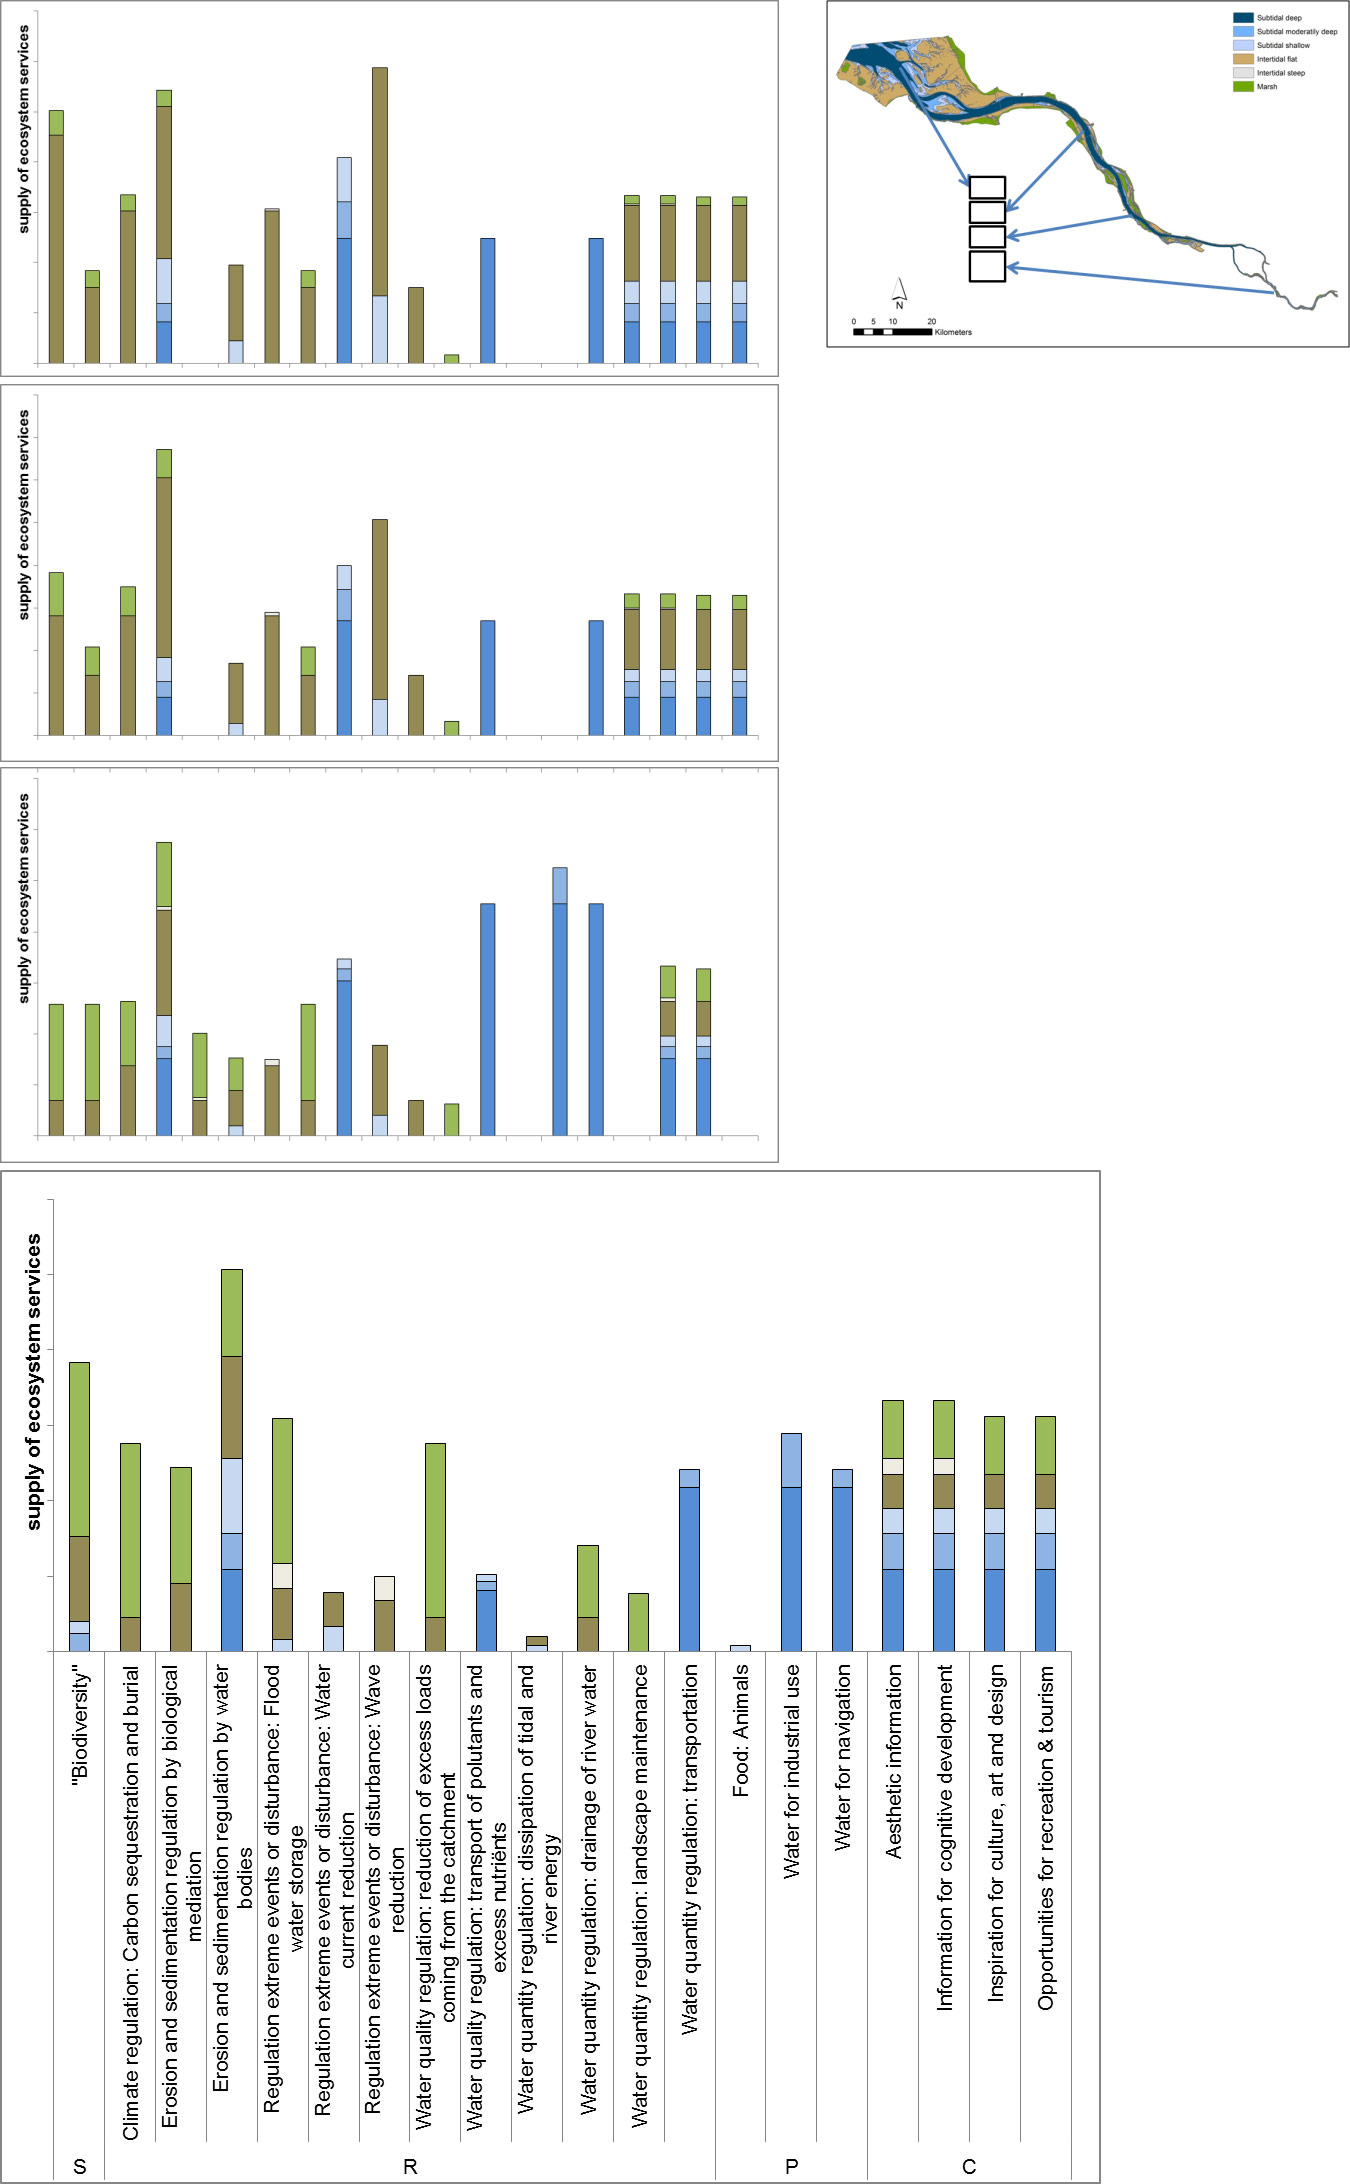
Humber

In the Scheldt (Figure 29), provisioning services show a low supply in freshwater and oligohaline zones. However, food provision supply is very low (less than 1% of scale). Low scores for food provision, were attributed since high levels of pollution prevent consumption of fish and filter feeders from the estuary. However, historically as well as potentially, this supply could thus be higher than shown here.
The increase in supply scores of provision of water and regulating functions for water quantity, as well as the higher proportions of deep and moderately deep subtidal habitats towards the mouth provoke an increase in supply of these services, while decreases in most other regulation services (regulation of extreme events and water quality) and habitat services are observed. Supply by marsh habitat is very low in the polyhaline zone. This is caused by the low surface of this habitat, as the supply does not vary much (see section 5.2).
The same holds for tidal flat habitat in the oligohaline and freshwater zone, and shallow subtidal habitat in all zones. Supply scores are high (see section 5.2), but due to low relative surfaces, the contribution to overall ecosystem service delivery is relatively low.
In the Weser (Figure 31), the overall contribution of tidal flat habitat to ecosystem service supply is remarkably high in the mesohaline and polyhaline zone. This is caused by the high proportional surface and the relatively high potential supply scores of this habitat.
The same holds for marsh habitat in the freshwater and oligohaline zone. Provisioning services are quite equally supplied along the estuarine gradient. The supply of supporting services is high and also quite stable along the estuarine gradient.
Water quality regulation and regulation of disturbance services are doing less in the meso- and polyhaline zone, since the proportion of marsh habitat is very low.
In the Elbe (Figure 32), the contribution of marsh habitat to ES supply decreases towards the mouth in favor of tidal flat habitat, as can be seen from for instance climate regulation and flood water storage services. This decrease is mainly driven by the difference in relative surface.
Provisioning services, such as water for industrial use and water for navigation, are mainly supplied in fresh and oligohaline zone, as the port activities are located in the more upstream area. Supporting services are mainly provided by intertidal flats and marshes, while subtidal habitats are more important for provisioning and water quantity regulating services.
In the Humber (Figure 33), the very low proportion of tidal flats and even lower for marshes in fresh and oligohaline zones yields a clearly different picture for the Humber. In the fresh water zone, shallow subtidal habitats are very important, while the deeper habitats increase importance towards the mouth.
Important to know
Reports / Measures / Tools
| Tool: | Ecosystem service trade-off risk tool (Decision support) |
|---|---|
| Tool: | Mapping tool for estuarine ecosystem service supply (Decision support) |
| Tool: | Survey tool for screening of estuarine ES demand and supply (Methodology) |
| Tool: | Defining Conservation goals based on Ecosystem Services in the Scheldt (Examples of good practice) |
Management issues
How can ecosystem services of estuaries be valued?How can public acceptance for management actions be increased?
How can the Ecosystem Services Approach be used to support management decisions?
How do TIDE estuaries deal with management problems?
How does habitat management affect the supply of ecosystem services?
How does the societal demand for ecosystem services vary along the estuary gradient?
What are the key areas of conflicts or synergies in TIDE estuaries?
What is important in establishing a zonation for estuaries?
Which aspects do I have to take into account in order to make a measure a success?
Which measures are suitable to achieve specific ecological targets?
Which measures are suitable to provide ecosystem services and benefits?
Which synergistic effects and conflicts can be expected by planning and implementing a certain measure?
“Working with nature”: What are the opportunities for sediment management in estuaries?