
Management measures analysis and comparison
Table of content
- 1. Aim of the study
- 2. Work organisation
- 2a. Transnational Working Group Measures (TWG Measures)
- 2b. Regional Working Groups
- 3. Working steps and methods
- 3a. Measure collection and compilation of basic information
- 3b. Analysis approach development
- 3c. Consistency check of analysis results
- 3d. Develop concepts for cross estuary comparison of measures
- 3e. Deduce recommendations for estuary managers
- 4. Pilot projects
- 5. Results of measure collection and analysis
- 5a. Measure collection and basic info compilation
- 5b. Measure analysis
- 6. Specific issues of cross estuary comparison of measures
- 6a. Managed re-alignment measures (APA)
- 6b. Measures influencing sedimentation processes (HPA)
- 7. Summary and conclusions
- 7a. Procedure
- 7b. Results
- 8. Recommendations
- 9. References
- 10. Annex
- 10a. Composition of Regional Working Groups identifying main pressures and resulting deficits for the estuary zone using Environmenta
- 10b. Templates for evaluation of measures in terms of WFD aims: Identification of pressures and explanation of resulting deficits for
- 10c. Templates for evaluation of measures in terms of Natura 2000 aims: Conservation objectives for relevant operational areas based
- 10d. List of collected measure examples from Weser, Elbe, Humber and Scheldt with indication of development targets
- 10e. Assignment of collected measure examples from Weser, Elbe, Humber and Scheldt to measure categories
- 10f. Overview maps on measure titles and locations
- 10g. Assignment of collected measure examples from Weser, Elbe, Humber and Scheldt to measure types
3b. Analysis approach development
The measure analysis focussed on describing the effects that can be obtained by the measures and on roughly estimating the effectiveness of a measure in view of different aspects and targets (e.g. development targets, ecosystem services (ES), Natura 2000 objectives, WFD objectives). In addition, lessons learned were collected and gaps of knowledge were identified, partly by involving the organisations in charge of measure planning and implementation. The set of analysis criteria was defined in consultation with all TIDE partners.The analysis process was based on the contents of the measure surveys including basic measure related information and an initial assessment of effectiveness (see 3.1) added by a more detailed, goal oriented study of available monitoring reports and/or modelling results as well as expert knowledge.
Main effectiveness criteria
The measure effectiveness was primarily analysed in view of the criteria ‘Effectiveness according to development targets of measure’, ‘Impact on ecosystem services (ES)’ and ‘Conflict potential and synergistic effects regarding uses’ (chapters 3.2.1.1 to 3.2.1.3).Effectiveness according to development targets of measure
The definition of development targets forms an integral part of the measure planning. Therefore, development targets were available for all measure examples considered. In order to roughly estimate the degree of target achievement (high, medium, low), the effectiveness of a measure related to its development targets was described and estimated.
Impact on ecosystem services (ES)
To analyse the measures regarding potential effects on different ecosystem services (ES) as defined in the frame of TIDE (Jacobs 2013), a two-step approach was executed.First step: Targeted ES
In a first step, the ES targeted by a measure were determined by comparing the measure development targets with the descriptions of ES (Jacobs 2013). Some measures target several ES while others aim at one single ES (Table 5). Only the ES “biodiversity” (category habitat services) is targeted by many TIDE management measures.
Table 5: First step of the ecosystem services (ES) analysis: Indication of targeted ES for each measure example based on the development targets.
| Ecosystem service* | Number of TIDE measures with this ES as target | |
| S | "Biodiversity" | 21 |
| R1 | Erosion and sedimentation regulation by water bodies | 6 |
| R2 | Water quality regulation: reduction of excess loads coming from the catchment | 1 |
| R3 | Water quality regulation: transport of pollutants and excess nutrients | 2 |
| R4 | Water quantity regulation: drainage of river water | 0 |
| R5 | Erosion and sedimentation regulation by biological mediation | 0 |
| R6 | Water quantity regulation: transportation | 0 |
| R7 | Water quantity regulation: landscape maintenance | 3 |
| R8 | Climate regulation: Carbon sequestration and burial | 0 |
| R9 | Water quantity regulation: dissipation of tidal and river energy | 6 |
| R10 | Regulation extreme events or disturbance: Wave reduction | 0 |
| R11 | Regulation extreme events or disturbance: Water current reduction | 0 |
| R12 | Regulation extreme events or disturbance: Flood water storage | 4 |
| P1 | Water for industrial use | 0 |
| P2 | Water for navigation | 5 |
| P3 | Food: Animals | 0 |
| C1 | Aesthetic information | 0 |
| C2 | Inspiration for culture, art and design | 0 |
| C3 | Information for cognitive development | 5 |
| C4 | Opportunities for recreation & tourism | 3 |
Second step: Involved habitats
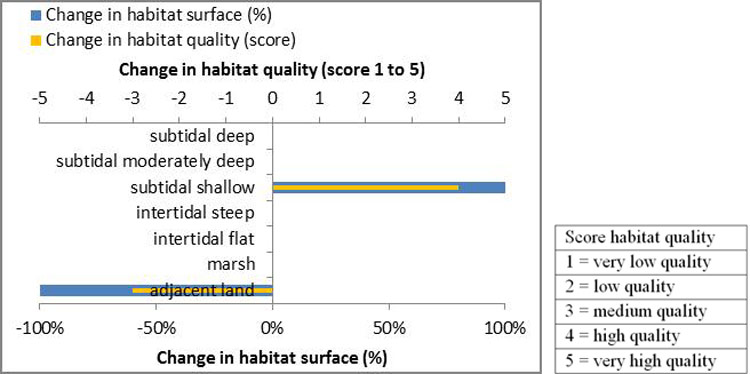
In a second step, the relative involvement of different habitats was evaluated following the habitat delineation as defined in the frame of TIDE (JACOBS 2013 ). The evaluation included both habitat surface (in % of measure site) and functional quality (scores from 1 to 5; see Table 6, Figure 2). Some measures create surface of a certain habitat while other measures improve the functional quality of a habitat without altering the surface. These factors were evaluated both for the starting situation and the situation after measure implementation. In the latter case, estimations are based on monitoring or modelling results.
Table 6: Second step of the ecosystem services analysis: Indication of habitat surface and quality before and after measure implementation (Example: APA 201 2k)
| Habitat quality score | ||||||||||
| 1 = very low quality | ||||||||||
| 2 = low quality | ||||||||||
| 3 = medium quality | ||||||||||
| 4 = high quality | ||||||||||
| 5 = very high quality | ||||||||||
| before | after | |||||||||
| surface (%) | quality (1-5) | surface (%) | quality (1-5) | |||||||
| Marsh habitat | above mean high water, floods at spring tide | 0 | 0 | 0 | 0 | |||||
| Intertidal steep habitat | floods every tide, mainly steep zones at marsh edges | 0 | 0 | 0 | 0 | |||||
| Intertidal flat habitat | floods every tide, flat zones | 0 | 0 | 0 | 0 | |||||
| Subtidal shallow habitat | never surfaces, less deep than 2m | 0 | 0 | 100 | 4 | |||||
| Subtidal moderately deep habitat | never surfaces, 2m-5m | 0 | 0 | 0 | 0 | |||||
| Subtidal deep habitat | never surfaces, deeper than 5m | 0 | 0 | 0 | 0 | |||||
| ADJACENT LAND | NON FLOODED LAND | 100 | 3 | 0 | 0 | |||||
| 100 | 100 | |||||||||
Assessment of ecosystem services: Indication of expected impact
These data (s. a.) was combined with the results of JACOBS 2013 that include an indication of the contribution of each habitat to the supply of ecosystem services (per estuary and per zone). The habitat contribution for the supply of ES is represented as a delivery score per habitat for each ES (JACOBS 2013 ).
An indicator for the expected increase or decrease in ES supply by the measure is provided by multiplying the delivery score (from the habitat-ES matrix, see JACOBS 2013 ) with the relative habitat change from the implementation of a measure (change in habitat surface and/or in habitat quality). For each TIDE measure, the analysis result is represented in a table (Table 7) with a score that maps the expected impact of the measure on the supply of each ES: from very negative (score -3, in dark red) to very positive (score +3, in dark green). Also the targeted ES are indicated in the table (orange box). A positive expected impact on ES that were not targeted indicates co-benefits of the measure.
It is important to emphasise that the resulting scores only apply within the boundary of the measure, since effects on adjacent land are not included. Hence, a conversion from adjacent land into estuarine habitat will cause positive effects on the supply of ES in the measure area. Negative effects will consequently only occur from a conversion from one estuarine habitat type into another, with the latter less suitable to supply certain ES.
Calculations: Expected ES supply from the implementation of a measure Per habitat type: Overall: Result: |

Based on the ES concept, the analysis described above gives an indication of the impact which can potentially be expected due to a measure. Additionally, it gives an indication of the measures’ contribution to various beneficiaries as well as an idea of the potential impact regarding the measure targets intended to be achieved. Also, the analysis indicates which co-benefits can potentially be expected from the measure. Moreover, aimed at and co-benefits obtained by the measures in view of different ES were distinguished by the combination with the targeted ES (First step: Targeted ES). This step actually visualizes win-win opportunities for measures planned and implemented in estuaries.
The supply of a certain service by a habitat can be multiplied by its surface to get this qualitative statement. However, the surface-supply relationship is not the same for all habitats and services. Differences exist in the quantity of this relationship: e.g. one hectare of tidal flat will not supply the same ‘amount of benefit’ for nutrient capture as for sedimentation regulation. Also, surface-supply curves might be linear, exponential or saturated: e.g. deeper water will increase navigation service, but after a certain amount is reached and demand is met, the service will not further increase.
It is important to emphasize that in this analysis, similar ES supplies per habitat and zones are assumed. However, habitats might differ substantially in quality and hence in ES supply. Therefore, a score for the local habitat quality as indicated by the members of the Transnational Working Group Measures (TWG Measures) was included in the calculation. This is however only a first rough qualitative estimation and it is recommended to compare the results with more local specificities of the measure to get an overall realistic view of the gained or lost ecosystem services. This analysis should be interpreted as a first indication of the expected impact on ES supply when implementing a certain measure.
For the measure 23 ‘Fish spawning pond” APA2012k) it is for example important to compare the result of the ES assessment with the local context. The Fish Spawning Pond is located adjacent to a harbour dock and is hence not directly connected to the estuary. Although with this measure some subtidal shallow habitat is created, it will evidently not impact all estuarine ES since it is not directly connected. More specifically, this means that most of the considered regulating and provisioning services are not relevant for this measure (such as erosion control regulation of extreme events and water provisioning). Hence it is important to verify the resulting expected impact of the ES assessment with the local context of the measure and put the non-relevant ES between brackets (Table 7).
Expected impact on beneficiaries
In a last part, the expected impact in view of different beneficiaries is analysed. Two types of beneficiaries are included. One set of beneficiaries depends on the users’ typology (direct, indirect and future use), and one set of beneficiaries depends on the spatial scale (local, regional and global use).
The first set of beneficiaries (direct, indirect and future users) is based on the widely used concept of Total Economic Value (TEV):
- Direct use is obtained through a removable product in nature (i.e. timber, fish, water); the outputs can be consumed directly.
- Indirect use is obtained through a non-removable product in nature (i.e. sunset, waterfall), i.e. societal or functional benefits.
- Future use (non-use) is the potential future ability to use a resource even though it is not currently used and the likelihood of future use is very low. This reflects the willingness to preserve an option for potential future use.

The expected contribution of each ES to the different beneficiaries is based on assigned values (Table 8). Habitat, regulating and cultural services are most beneficial for indirect and future use, while provisioning services are typically linked with direct use. Furthermore, most ES are beneficial at a local and regional scale and only a limited number of ES are beneficial at a global scale (mainly climate regulation).
This is combined with the expected impact of the measure on the supply of each ES (see above) to assess the expected impact of the measure on the various beneficiaries. The resulting dimensionless score of expected impact on the different beneficiaries is also transformed to a scale of -3 (very negative impact) to +3 (very positive impact).
Table 8: Expected contribution of each ES to different beneficiaries (in %)
| Ecosystem services* | Beneficiaries: users typology** | Beneficiaries: spatial typology** | |||||
| Direct use | Indirect use | Future (non-use) | Local | Regional | Global | ||
| S | "Biodiversity" | 0 | 20 | 80 | 30 | 30 | 40 |
| R1 | Erosion and sedimentation regulation by water bodies | 0 | 50 | 50 | 70 | 30 | 0 |
| R2 | Water quality regulation: reduction of excess loads coming from the catchment | 0 | 70 | 30 | 30 | 40 | 30 |
| R3 | Water quality regulation: transport of pollutants and excess nutrients | 0 | 70 | 30 | 30 | 40 | 30 |
| R4 | Water quantity regulation: drainage of river water | 0 | 30 | 70 | 30 | 70 | 0 |
| R5 | Erosion and sedimentation regulation by biological mediation | 0 | 50 | 50 | 70 | 30 | 0 |
| R6 | Water quantity regulation: transportation | 0 | 70 | 30 | 20 | 70 | 10 |
| R7 | Water quantity regulation: landscape maintenance | 0 | 50 | 50 | 70 | 30 | 0 |
| R8 | Climate regulation: Carbon sequestration and burial | 0 | 0 | 100 | 10 | 10 | 80 |
| R9 | Water quantity regulation: dissipation of tidal and river energy | 0 | 30 | 70 | 70 | 30 | 0 |
| R10 | Regulation extreme events or disturbance: Wave reduction | 0 | 30 | 70 | 70 | 30 | 0 |
| R11 | Regulation extreme events or disturbance: Water current reduction | 0 | 30 | 70 | 70 | 30 | 0 |
| R12 | Regulation extreme events or disturbance: Flood water storage | 0 | 30 | 70 | 70 | 30 | 0 |
| P1 | Water for industrial use | 100 | 0 | 0 | 70 | 30 | 0 |
| P2 | Water for navigation | 20 | 80 | 0 | 20 | 70 | 10 |
| P3 | Food: Animals | 100 | 0 | 0 | 70 | 30 | 0 |
| C1 | Aesthetic information | 0 | 50 | 50 | 40 | 40 | 20 |
| C2 | Inspiration for culture, art and design | 0 | 50 | 50 | 40 | 40 | 20 |
| C3 | Information for cognitive development | 0 | 50 | 50 | 40 | 40 | 20 |
| C4 | Opportunities for recreation & tourism | 20 | 40 | 40 | 40 | 40 | 20 |
* Habitat services (S); Regulating services (R); Provisioning services (P); Cultural services (C)
**in %
Calculations: Per ES: Beneficiaries: Result: |
The beneficiaries’ analysis is represented per measure in a table (Table 9) with a score per beneficiary group representing the expected impact of the measure: from very negative (score -3, in dark red) to very positive (score +3, in dark green).

Conflict potential and synergistic effects regarding uses
Conflicts and synergistic effects were described and estimated that occurred during the planning stages or after implementation of a measure in view of different uses and interests. Conflicts and synergistic effects in view of agriculture, fishery, shipping and ports, leisure and local recreation, tourism, nature conservation, housing development, coastal defence, flood protection and industry were taken into account.Additional evaluation criteria in view of EU environmental law
In addition to the main effectiveness criteria (chapter 3.2.1), additional evaluation criteria in view of EU environmental law (WFD, Natura 2000) were defined (chapters 3.2.2.1, 3.2.2.2).Conflicts and synergistic effects regarding WFD
At this point in time, the majority of the European surface water bodies do not meet WFD requirements (NLWKN 2010). In order to achieve the directive’s aims until 2015/2021, suitable measures have to be designed, planned and implemented. To do so successfully, the specific pressures a water body is affected by are to be taken into account. This means that a measure is the most effective if it tackles the main pressures of the respective surface water section. In order to estimate potential effects of the measure examples considered in terms of WFD, a relationship to existing pressures was made and the resulting deficits in view of WFD quality elements were described.To identify the main pressures, different categories of Environmental Integrative Indicators (EIIs) as defined by Aubry and Elliott (2006) were taken as a basis. An environmental indicator is a qualitative or quantitative parameter characterising the current condition of an element of the environment (e.g. tonnage of material dredged). After Aubry and Elliott 2006, environmental indicators have the following three basic functions:
- To simplify: Amongst diverse components of an ecosystem, few indicators are selected according to their perceived relevance for characterising the overall state of the estuary
- To quantify: The value of the indicator is compared with reference values considered to be characteristic of ‘pristine’ or heavily impacted ecosystems. For example, the ecological status of water bodies assigned under the WFD related to the determination of changes from reference to expected conditions.
- To communicate: The use of indicators facilitates communication on environmental issues to stakeholders and policy makers by promoting information exchange and comparison of spatial and temporal patterns.
- State Indicator: Indicates the current state of a system (= estuary zone) looking at the changes that took place in the past.
- Driver Indicator: Indicates the processes and activities which caused the current state of the system (= estuary zone)
| Indicator category* | Code** | Description |
| State Indicator | 1.1 | Habitat loss and degradation during the last about 100 years: Intertidal |
| - | Habitat loss and degradation during the last about 100 years: Subtidal | |
| 1.4 | Gross change in morphology during the about 100 years | |
| 1.5 | Gross change in hydrographical regime during the last about 100 years | |
| 3.1/3.2 | Decrease of water and sediment chemical quality | |
| 3.3 | Increased chemical loads on organisms | |
| 3.4 | Decrease of microbial quality | |
| 3.8 | Aesthetic pollution | |
| Driver Indicator | 1.3 | Land claim during the last about 100 years |
| 1.7 | Relative Sea Level Rise | |
| 2.3 | Discharge of nutrients and/or harmful substances | |
| 2.4 | Maintenance dredging | |
| 2.5a | Relocation of dredged material | |
| 2.8 | Wind farm development | |
| 2.9 | Aquaculture | |
| 2.10 | Fisheries activities | |
| 2.11 | Marina development | |
| 2.12 | Port developments | |
| - | Industrial development | |
| 2.13 | Installation of pipelines and cables | |
| 2.14 | Oil and gas exploration and production | |
| 2.16 | Tourism and recreation |
*Subdivision into state and driver indicators took place in the frame of TIDE.
**Codes for EIIs according to AUBRY AND ELLIOTT 2006; EIIs without indication of code were added in the frame of TIDE.
First step: Pressures screening
The identification of pressures was based on surveys filled in by Regional Working Groups (RWGs) at the TIDE estuaries. The RWG composition at Weser, Elbe, Humber and Scheldt can be taken from annex 10.1. Details on the WFD survey can be taken from annex 10.2 .
An EII scored highly or very highly relevant was supposed to map potential main pressures of the respective estuary zone. The zonation schemes used in the frame of TIDE can be taken from GEERTS et al. 2011. For each estuary zone, not more than six main pressures were to be named.
Second step: Evaluation of measure effects
In a second step, the results of the pressures screening were taken as a basis to produce template tables referring to the different estuary zones defined for Weser, Elbe, Humber and Scheldt. These were used to indicate and describe the measure effects regarding the main pressures identified for the estuary zone where the measure was planned or implemented (Tables 11 - 12).
Table 11: Effects of measure ‘Tidal habitat Vorder- und Hinterwerder’ (SAATHOFF AND KLUGKIST 2012 ) on main pressures identified for freshwater zone of Weser estuary
| Indicator Group | Code | Main pressures freshwater zone Weser | Effect? | Description | ||||
| - | 0 | + | ||||||
| S.I. | - | Habitat loss and degradation during the last 100 years: Subtidal | X | Additional subtidal area was created (shallow water zone). | ||||
| S.I. | 1.1 | Habitat loss and degradation during the last 100 years: Intertidal | X | Intertidal habitats were developed (e.g. reeds and mudflats). | ||||
| S.I. | 1.4/ 1.5 | Gross change in morphology/hydrographic regime during the last about 100 years | X | Due to Weser deepening, many side habitats of the river including shallow water got lost. The compensation measure creates new side habitats and therefore contributes to mitigating negative effects of the gross changes in morphology/hydrographic regime. | ||||
| D.I. | 1.3 | Land claim during the last about 100 years | X | By partly lowering a summer dike and increasing the tidal influence on the project area, land formerly used for agricultural purposes was given back to the river. | ||||
| D.I. | 1.7 | Relative Sea Level Rise | X | Project area provides additional holding capacity. | ||||
| D.I. | 2.6 | Capital dredging | X | There are no direct effects to be stated, but measure generally contributes to mitigating the negative effects of capital dredging. | ||||
S.I. = state indicator; D.I. = driver indicator
Table 12: Effects of measure ‘Tegeler Plate – development of tidally influenced brackish water habitats’ (SAATHOFF UND WERNICK 2012) on main pressures identified for oligohaline zone of Weser estuary
| Indicator Group | Code | Main pressures oligohaline zone Weser | Effect? | Description | ||||
| - | 0 | + | ||||||
| S.I. | - | Habitat loss and degradation during the last 100 years: Subtidal | X | As a result of measure implementation, additional subtidal areas were created. | ||||
| S.I. | 1.1 | Habitat loss and degradation during the last 100 years: Intertidal | X | As a result of measure implementation, additional intertidal areas were created. | ||||
| S.I. | 1.4/ 1.5 | Gross change in morphology/hydrographic regime during the last about 100 years | X | Natural erosion and sedimentation processes were promoted. | ||||
| D.I. | 1.3 | Land claim during the last about 100 years | X | Due to measure implementation, the tidal influence on the project area was increased and the Tegeler Plate – formerly used for agricultural purposes- was nearly completely left to natural succession. | ||||
| D.I. | 2.6 | Capital dredging | X | There are no direct effects to be stated, but measure generally contributes to mitigating the negative effects of capital dredging. | ||||
| D.I. | 2.4 | Maintenance dredging | X | Due to measure implementation, the Tegeler Plate provides additional sedimentation area. As a consequence, this may lead by trend to less maintenance effort in the river Weser. | ||||
S.I. = state indicator; D.I. = driver indicator
Conflicts and synergistic effects regarding Natura 2000
Major parts of the TIDE estuaries belong to the European Natura 2000 network (NLWKN, SUBV 2012). The Natura 2000 network includes protected areas after the Habitat Directive (RL 92/43/EWG) and the Birds Directive (RL 2009/147/EG). The Habitat Directive (HD) wants to contribute to biodiversity within the member states of the European Union (EU) by protecting natural habitats and species (see HD, Article 2 (1)). The Birds Directive (BD) aims at protecting all native bird species. After both directives, protected areas with specific conservation objectives are to be declared. These conservation objectives were taken into account to estimate the synergistic effects of a measure in view of Natura 2000 aims. If a measure was not planned or implemented in a Natura 2000 site and has no effect on adjacent Natura 2000 sites, no analysis according to this criterion took place.The analysis of potential synergistic effects and conflicts of measures in view of Natura 2000 was designed to follow a two-step approach. In fact, the two-step approach was exclusively realised for measures planned and implemented at the Weser estuary. The individual proceedings realised at the different TIDE estuaries are described below.
First step: Effectiveness regarding conservation objectives for defined spatial units
The first analysis step represents a rough screening of the effectiveness of measures in view of Natura 2000 objectives for certain spatial units (Table 13). Potential positive and negative measure effects in view of the objectives defined were estimated by combining the development targets of the measures (including the degree of target achievement, see 3.2.1.1) with the conservation objectives of the spatial unit where the measure was planned or implemented. The Natura 2000 site where the respective measure is situated can be taken from the measure survey (see 3.1).
Table 13: First step of Natura 2000 analysis: Indication of potential effects on Natura 2000 objectives defined for a certain spatial unit following a simple valuation system (++, +, 0, -, --)
| Conservation objective for spatial unit | Effects of measure | ||||
| very positive (++) | positive (+) | no effects (0) | negative (-) | very negative (--) | |
| Conservation objective 1 | |||||
| Conservation objective 2 | |||||
| Conservation objective 3 | |||||
| … | |||||
Second step: Effectiveness regarding overall conservation objectives
The second analysis step comprises a comparison with overall Natura 2000-conservation objectives ideally referring to the entire tidally influenced river sections (Table 14). If a measure tackles an overall Natura 2000 objective, its effectiveness increases.
Table 14: Step 2 of Natura 2000 analysis: Indication of potential effects on overall conservation objectives following a simple valuation system (++, +, 0, -, --)
| Overall conservation objective | Effects of measure | ||||
| very positive (++) | positive (+) | no effects (0) | negative (-) | very negative (--) | |
| Conservation objective 1 | |||||
| Conservation objective 2 | |||||
| Conservation objective 3 | |||||
| ... | |||||
Regarding both analysis steps, the indication of positive and negative effects followed a simple valuation system (very positive, positive, no effects, negative, very negative).
Analysis proceeding for measures planned or implemented at the Weser estuary
The analysis of the Weser measures in view of Natura 2000 is based on the contents of the Integrated Management Plan Weser (NLWKN, SUBV 2012). The plan refers to Natura 2000 sites of the tidally influenced river sections of the Weser and was set up based on administrational agreements of the bordering federal states and the federal waterways administration.
The Integrated Management Plan Weser (IMP Weser) aims at describing ecological and economic conditions, interests and planning and at deriving possible solutions for a successful implementation of the Natura 2000 directives within the investigation area. The plan is based on an extensive participation process in order to give stakeholders the chance to hold their view (see also Boyes, Cutts 2012)
The federal state governments of Lower Saxony and Bremen were assigned to coordinate the interdisciplinary stakeholder groups and to work out a program of targets and measures in order to preserve the Natura 2000 subjects of protection.
The IMP Weser is not legally binding, but is to serve as guidance for future state action in Lower Saxony and Bremen.
The investigation area of the IMP Weser is subdivided into the following seven operational areas (Figure 4):
- Operational area 1: Meso-/polyhaline zone in the outer Weser estuary (Weser-km 40 - 65)
- Operational area 2: Oligohaline zone in the lower Weser (Weser-km 40 - 65)
- Operational area 3: Fresh water zone in the lower Weser (Weser-km 12 - 32)
- Operational area 4: Side branches of the oligohaline zone (Schweiburg and Rechter Nebenarm)
- Operational area 5: Side branches of the fresh water zone (Rekumer Loch, Woltjenloch, Westergate, Warflether Arm)
- Operational area 6: Tributary Hunte (fresh water)
- Operational area 7: Tributary Lesum (fresh water)

Each operational area represents an ecologically consistent subunit of the IMP Weser investigation area, which can be described and assessed. For each operational area, Natura 2000 conservation objectives were formulated (for example see ‘Shallow water area Rönnebecker Sand’ within operational area 3/freshwater zone, Table 15). The conservation objectives for the operational areas relevant in the frame of TIDE (operational areas 1 - 3) can be taken from annex 8.3
Table 15: Natura 2000-objectives with specifications for operational area 3 in the lower Weser estuary after NLWKN, SUBV 2012 (Example: SAATHOFF AND LANGE 2012C ). In the frame of the measure analysis, the measure effects were indicated following a simple valuation system (very positive (++); positive (+); no effects (0); negative (-); very negative (--))
| Operational area 3: Freshwater zone in the lower Weser (Weser km 12 - 32) | ||||
| Specifications for operational area 3 | Effect of measure ‘Shallow water area Rönnebecker Sand’ on conservation objectives | Short explanation | ||
| positive effect | no effect | negative effect | ||
| Conservation and development of specific estuarine habitats and (tidal) floodplains and their dynamic changes | ||||
| Development, enlargement and upgrade of shallow water zones with moderate current climate | ++ | A shallow water zone with reduced tidal range was created. | ||
| Development of passable shore structures | + | The shallow water zone is connected to the Weser River by an overflow barrier that is basically passable for organisms. | ||
| Conservation and development of typical habitats of operational area 3 (e.g. river flats, reeds and typical shore vegetation not being affected by neophytes, tidal floodplains and extensively used grasslands) in a dimension, spatial distribution and interconnection ensuring long-term appearance of typical species | ++ | Typical habitats of operational area 3 were developed (e.g. reeds, extensively used grassland). | ||
| Conservation and development of tidal floodplains at the upper tidal border | ++ | The shallow water area Rönnebecker Sand takes over various functions of tidal floodplain backwaters. | ||
| Conservation and development of habitats for viable populations and estuary and (tidal) floodplain specific species as well as species after Annex II Habitats Directive and bird species after Birds Directive | ||||
| Conservation of typical breeding bird communities and associated habitats (breeding birds of grasslands, reeds and tidal floodplains) | + | The project area represents a breeding site of importance for the federal state of Lower Saxony (Bios 2007a) | ||
| Conservation and development of undisturbed resting and moulting areas for migratory bird populations (high diversity, many individuals) considering all necessary functions | + | The migratory bird population can be described as species and individuals rich due to structure diversity (e.g. shallow and deep water, grassland) and due to few disturbances (Bios 2007a) | ||
| Conservation and development of well-structured bordering waters and shore areas with wood, typical shore vegetation and reeds as hunting and feeding ground for Pond bat (Myotis dasycneme) | + | Not investigated, but the occurrence of Pond bat is likely. | ||
| Preservation and development of spawning ground function for Twaite shad (e.g. by avoiding disturbances during spawning season) | + | In 2009, some spawn of Twait shad was found in the shallow water zone. Due to low current velocities, the shallow water zone itself is not supposed to serve as spawning ground for Twaite shad. However, discharges of oxygen, zooplankton (Eurytemora affinis) and Mysida from the shallow water zone directly into the main spawning ground of Twaite shad take place and contribute to improving the growing conditions (Haesloop 2009). | ||
| Conservation and development of spawning ground function for Smelt (Osmerus eperlanus) (e.g. by avoiding disturbances during spawning season) | + | Larvae and juveniles were found in the shallow water zone in 2004/2005 and in 2009 (Haesloop 2009). | ||
Additionally, Natura 2000 objectives for the entire IMP investigation area Weser were formulated (for example see ‘Shallow water area Rönnebecker Sand’, Table 16).
Table 16: Natura 2000-objectives with specifications for entire investigation area of the Integrated Management Plan Weser after NLWKN, SUBV 2012 (Example: SAATHOFF AND LANGE 2012C ). In the frame of the measure analysis, the measure effects were indicated following a simple valuation system (very positive (++); positive (+); no effects (0); negative (-); very negative (--)).
| Specifications for entire investigation area of IBP Weser | Effect of measure ‘Shallow water area Rönnebecker Sand’ on conservation objectives | ||
| positive effect | no effect | negative effect | |
| Conservation and development of specific functions and processes of estuaries and (tidal) floodplains to reach favourable abiotic conditions and typical hydromorphological structures | |||
| Conservation and development of favourable water structures and water bed dynamics |
++ | ||
| Development of evenly distributed and reduced current energy and tidal parameters |
++ | ||
| Conservation and development of favourable gradients of specific aspects regarding estuaries and (tidal) floodplains (e.g. salinity, sediments, current conditions, tidal range, close-to-nature zonation of shore vegetation…); refers to inner estuary and to area between estuary and floodplain within fresh water zone. |
+ | ||
| Improvement of water and sediment quality | + | ||
| Conservation and development of specific estuarine habitats and (tidal) floodplains and their dynamic changes | |||
| Conservation and development of habitats and communities which strongly depend on the natural dynamics of morphological processes (e.g. mudflats, shallow waters, creeks… ) |
+ | ||
| Development of balanced area percentages regarding mudflats, shallow waters, shallow and deep sublitoral |
+ | ||
| Conservation and development of tidal floodplains with typical vegetation structures and biocoenosis and favourable tidal and flooding dynamics; especially floodplain enlargement |
+ | ||
| Conservation and development of habitats for viable populations and estuary and (tidal) floodplain specific species as well as species of Annex II Habitats Directive and bird species of Birds Directive | |||
| Conservation of habitat functions for breeding and migrant birds especially as feeding grounds (also for bordering or networked areas) |
+ | ||
| Conservation and development of habitat requirements for migratory fish stocks and Cyclostomata within present territories and networked areas |
+ | ||
| Conservation and development of habitat requirements for autochthon fish communities with typical age composition and typical percentage of estuarine species and diadromous migratory fish species |
+ | ||
| Conservation and development of long-term viable populations of typical fish species and cyclostomata (estuarine and diadromous guilds) |
+ | ||
| Reaching of favourable water quality for reproduction, larval development and viability of typical fish communities of different salinity zones |
+ | ||
| Conservation and development / reestablishment of passability of the tidal river Weser and its tributaries for migratory fish and benthic invertebrates |
0 | ||
The Natura 2000 analysis of the Weser measures refers to the conservation objectives on both levels. The most effective measures tackle both the overall conservation objectives and the area specific conservation objectives.
Analysis proceeding for measures planned or implemented at the Elbe estuary
The analysis of the Elbe measures in view of Natura 2000 is based on the contents of the Integrated Management Plan Elbe (AG Elbe 2012).The plan refers to Natura 2000 sites of the tidally influenced river sections of the Elbe and was set up based on administrational agreements of the bordering federal states, the port and waterways administrations.
The Integrated Management Plan (IMP) for the tidally influenced section of the river Elbe aims at describing ecological and economic conditions, interests and planning and at deriving possible solutions for a successful implementation of the Natura 2000 directives within the investigation area. The plans are based on an extensive participation process in order to give stakeholders the chance to hold their view (see also Boyes, Cutts 2012).
The IMP Elbe is not legally binding, but is to serve as guidance for future state action.
The investigation area of the IMP Elbe is subdivided into seven operational areas:
- Operational area 1: from Geesthacht to Hamburg
- Operational area 2: Hamburger Hafen
- Operational area 3: Hamburg to Lühesand
- Operational area 4: Lühesand to Brokdorf
- Operational area 5: Brokdorf to Oste tributary
- Operational area 6: Oste tributary to Cuxhaven/Neufeld
- Operational area 7: Tributaries Pinnau, Krückau, Stör and Oste
Analysis proceeding for measures planned or implemented at the Scheldt estuary
The analysis of the Scheldt measures in view of Natura 2000 is based on the contents of the Long Term Vision (LTV 2001) for the Scheldt estuary for 2030 and Development plan 2010 (Ontwikkelingsschets – OS; Proses 2004). These bilateral agreements fit in the long-term cooperation between both neighbour states. The overall target of LTV includes the conservation of the physical characteristics of the estuary and the optimal balance between safety, accessibility and environment. Regarding the environmental aspect, this means specifically the sustainable preservation of a large diversity of habitats with associated species communities until 2030. Therefore, ecological objectives were developed regarding the naturalness aim from the LTV:
- A large diversity in estuarine habitat (marshes, mudflats, shallow water and sandbars in fresh, brackish and saline water) with sustainable associated life communities;
- Space for natural dynamical physical, chemical and ecological processes. Maintenance of the multiple-channel system in the Westerschelde;
- The water quality may not be a limiting factor anymore.
The conservation objectives were developed separately for both parts of the Scheldt estuary. For the Westerschelde (The Netherlands), conservation objectives were developed within the general Natura 2000 management plan. For the Zeeschelde (Flanders), conservation objectives were developed separately for the Scheldt estuary already in 2005.
Conservation objectives Zeeschelde (Flanders, Belgium)
The objectives for the different EU directives (WFD, BHD) and the LTV for the Scheldt are interrelated and integrated in three hierarchical levels including the ecosystem level, the habitat level and the species level. The carrying capacity of the ecosystem is the highest level. The objectives for habitats and species are subordinated to that, but therefore not less important.
On the habitat level, conservation objectives are defined depending on the relative importance of habitats (essential, important, locally important). For all listed habitats, a good condition should be guaranteed including a minimal surface and specific abiotic conditions (Table 17).
Table 17: Important habitats defined for the Zeeschelde (Flanders, Belgium) according to Habitat Directive (RL 92/43/EWG); Adriaensen et al 2005
| Importance of the habitat in Flanders | |
| “Essential” |
|
| “Important” |
|
| “Locally important” |
|
On the species level, conservation objectives referring to pelagial, mudflats, marshes as well as structural diversity and connectivity are formulated. A detailed list of the conservation objectives defined on the species level can be taken from 10 8.3.
Conservation objectives Westerschelde (The Netherlands)
General objectives are to conserve or restore
- the contribution of the Natura 2000-area to the ecological consistency of Natura 2000 both in the Netherlands and in the European Union,
- the contribution of the Natura 2000-area to the biological diversity and to the favourable state of conservation of natural habitats and species in the European Union,
- the natural characteristics of the Natura-2000 area, including the consistency of the structure and functions of the habitat types and of the targeted species
- and the area-relevant ecological objectives of the targeted habitat types and species.
- Sandbanks which are slightly covered by sea water all the time (H1110)
- Estuaries (H1130)
- Salicornia and other annuals colonizing mud and sand (H1310)
- Spartina swards (Spartinion maritimae) (H1320)
- Atlantic salt meadow (Glauco-Puccinellietalia maritmae) (H1330)
- Embryonic shifting dunes (H2110)
- Shifting dunes along the shoreline with Ammophila arenaria (“white dunes”) (H2120)
- Dunes with Hippophaë rhamnoides (H2160)
- Humid dune slacks (H2190)
- Narrow-mouthed whorl snail (Vertigo angustior) (H1014)
- Sea lamprey (Petromyzon marinus) (H1095)
- European river lamprey (Lampetra fluviatilis) (H1099)
- Twaite Shad (Alosa fallax) (H1103)
- Earless seal (Phocidae) (H1365)
- Liparis loeselii (H1903)
Table 18: Conservation objectives formulated for the Westerschelde (The Netherlands) in view of breeding birds according to the Birds Directive (RL 2009/147/EG) with indication of minimum population
| Code | Specie name | Scientific name | Conservation Objective: Minimum number of bird couples |
| A081 | Western Marsh Harrier | Circus aeruginosus | 20 |
| A132 | Pied Avocet | Recurvirostra avosetta | 2000 |
| A137 | Common Ringed Plover | Charadrius hiaticula | 100 |
| A138 | Kentish Plover | Charadrius alexandrines | 220 |
| A176 | Mediterranean Gull | Ichthyaetus melanocephalus | 400 |
| A191 | Sandwich Tern | Thalasseus sandvicensis | 4000 |
| A193 | Common Tern | Sterna hirundo | 6500 |
| A195 | Little Tern | Sternula albifrons | 300 |
| A272 | Bluethroat | Luscinia svecica | 450 |
Table 19: Conservation objectives formulated for the Westerschelde (The Netherlands) in view of non-breeding birds according to the Birds Directive (RL 2009/147/EG) with indication of minimum numbers
| Code | Specie name | Scientific name | Conservation Objective: average number of birds (seasonal average) |
| A005 | Grebe | Podicipedidae | 100 |
| A026 | Little Egret | Egretta garzetta | 40 |
| A034 | Eurasian Spoonbill | Platalea leucorodia | 30 |
| A041 | Greater White-fronted Goose | Anser albifrons | 380 |
| A043 | Greylag Goose | Anser Anser | 16600 |
| A048 | Common Shelduck | Tadorna tadorna | 4500 |
| A050 | Eurasian Wigeon | Anas penelope | 16600 |
| A051 | Gadwall | Anas strepera | 40 |
| A052 | Eurasian Teal | Anas crecca | 1100 |
| A053 | Mallard | Anas platyrhynchos | 11700 |
| A054 | Northern Pintail | Anas acuta | 1400 |
| A056 | Northern Shoveler | Anas clypeata | 70 |
| A069 | Red-breasted Merganser | Mergus serrator | 30 |
| A075 | Fish Eagle | Haliaeetus | 2 |
| A103 | Peregrine Falcon | Falco peregrinus | 7500 |
| A130 | Eurasian Oystercatcher | Haematopus ostralegus | 7500 |
| A132 | Pied Avocet | Recurvirostra avosetta | 540 |
| A137 | Common Ringed Plover | Charadrius hiaticula | 430 |
| A138 | Kentish Plover | Charadrius alexandrines | 80 |
| A140 | European Golden Plover | Pluvialis apricaria | 1600 |
| A141 | Grey Plover | Pluvialis squatarola | 1500 |
| A142 | Northern Lapwing | Vanellus vanellus | 4100 |
| A143 | Red Knot | Calidris canutus | 600 |
| A144 | Sanderling | Calidris alba | 1000 |
| A149 | Dunlin | Calidris alpina | 15100 |
| A157 | Bar-tailed Godwit | Limosa lapponica | 1200 |
| A160 | Eurasian Curlew | Numenius arquata | 2500 |
| A161 | Spotted Redshank | Tringa erythropus | 270 |
| A162 | Common Redshank | Tringa totanus | 1100 |
| A164 | Common Greenshank | Tringa nebularia | 90 |
| A169 | Ruddy Turnstone | Arenaria interpres | 230 |
Summarised, the Natura 2000 analysis of the Scheldt measures refers to both the overall ecological objectives for the estuary (LTV and OS) and the regional conservation objectives for the region in which the measure is situated (Westerschelde or Zeeschelde).
Analysis proceeding for measures planned or implemented at the Humber estuary
The analysis of the Humber measures in view of Natura 2000 is based on the Humber Management Scheme (HMS) which aims to deliver sustainable management of the Humber Estuary European Marine Site (HMS 2011). The Humber European Marine Site, which the HMS was set up to manage, covers the marine areas (land covered continuously or intermittently by tidal waters) of the Humber Estuary SAC, the SPA and Ramsar sites. The objectives of the HMS 2011a are five-fold as outlined below:
- To manage the estuary to meet the requirements of the conservation objectives
- To bring people and organizations together to deliver the sustainable management of the Humber Estuary European Marine Site
- To raise awareness and educate stakeholders about the Humber Estuary European Marine Site and increase participation in its management
- To identify information gaps and research requirements and to promote sharing and availability of data for the management of the Humber Estuary European Marine Site
- To ensure a coordinated approach to the management of the estuary and its hinterlands including planning for the future in respect to the features of the Humber Estuary European Marine Site


Through the consultation the HMS action plans were developed for the sustainable management of the Humber Estuary European Marine Site (Figure 5). The actions will be delivered by both statutory and non-statutory organizations individually or as a partnership through the Humber Estuary Relevant Authorities Group (HERAG) and the Humber Advisory Group (HAG). Some actions will also be lead by the Humber Management Scheme. Through consultation the HMS has identified five key areas for delivery to ensure the sustainable management of the Humber Estuary European Marine Site (HMS 2011a):
- Habitat and species management
- Recreation and tourism
- Communication
- Monitoring, information and research
- Integrated management and forward planning
Detailed objectives:
- Habitat management: To identify and deliver habitat management to meet the conservation objectives
- SPA birds: To identify and deliver management for SPA birds to meet the conservation objectives including the management of high tide roosting and feeding areas.
- Sub-tidal: To identify and deliver management for the sub-tidal to meet the conservation objectives
- Grey seals: To identify and deliver management for the grey seals to meet the conservation objectives
- Lamprey: To identify and deliver management for the river and sea lamprey to meet the conservation objectives
Crux of the matter
Finally, the individual frame conditions and the lessons learned in the process of planning and implementing a measure were taken into account. An initial description of the lessons learned is an integral part of the measure surveys (see 3.1). These were taken as a basis for more comprehensive descriptions ideally based on the experiences of people directly involved in the planning and implementation process.Important to know
Reports / Measures / Tools
| Report: | Management measures analysis and comparison |
|---|
Management issues
How and by which management measures can tidal amplification be reduced?How can public acceptance for management actions be increased?
How can the Ecosystem Services Approach be used to support management decisions?
How can we assure accessibility to an inland estuarine port without affecting the habitats and safety against flooding?
How can we prevent excessive degradation or loss of tidal marshes?
How does habitat management affect the supply of ecosystem services?
What are the key areas of conflicts or synergies in TIDE estuaries?
What are the restoration opportunities for side branch systems and river banks (e.g. left side branch Weser)?
What factors determine the distribution of suspended sediments in an estuary?
What measures are successful for the dissipation of tidal energy?
What monitoring is required to support and assess management decisions?
What parameters should be used to define and evaluate measure targets?
What tool is available to help manage multiple users of a resource in an integrated way (i.e. achieving more holistic management)?
Which aspects do I have to take into account in order to make a measure a success?
Which measures are suitable to achieve specific ecological targets?
Which measures are suitable to achieve specific morphological and hydrological targets?
Which measures are suitable to identify, protect or develop valuable submerged habitats e.g. mussel beds and Sabellaria reefs?
Which measures are suitable to improve the physical characteristics and chemical water quality?
Which measures are suitable to provide ecosystem services and benefits?
Which synergistic effects and conflicts can be expected by planning and implementing a certain measure?
“Working with nature”: What are the opportunities for sediment management in estuaries?