
Disclaimer:
The authors are solely responsible for the content of this report. Material included herein does not represent the opinion of the European Community, and the European Community is not responsible for any use that might be made of it.
Back to overview reports
Habitat areas were measured in each estuary in selected years based on available historical habitat maps. Habitat maps for the years 1975, 1993 and 2008 were obtained for the Humber through the digitisation of Admiralty Charts, using bathymetry levels to distinguish subtidal, intertidal and supratidal habitats (in this case habitat maps did not cover the two upper sectors, NA1 and NA2). Maps for 1950 and 1995 were used for the Elbe and 1950 and 2000 maps were obtained for the Weser. A monotonous linear decrease/increase of the area of each habitat between these years was considered and the habitat area was calculated accordingly for the missing years, extending the calculation to a maximum of 3 years after the year of the last available habitat map.
An example of this calculation for sector NB in the Humber Estuary is reported below. Dashed black lines indicate the habitat data derived with direct measure from historical habitat maps (in this case, available for the years 1975, 1993 and 2008).
b) Dominant intertidal habitat type
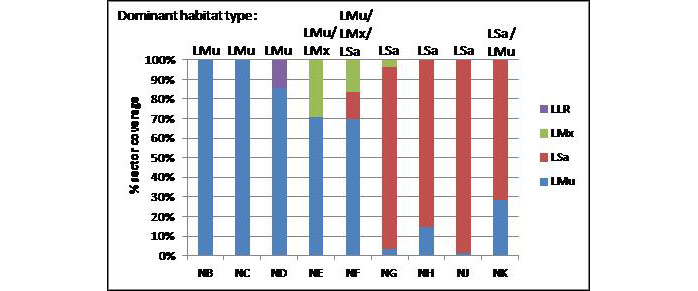
The dominant intertidal habitat type present within WeBS sectors was identified based on the EUNIS 3 habitat map given in Hemingway et al. (2008) and on the % coverage of these habitats in each sector. EUNIS 3 habitats included Littoral mud (LMu), Littoral sand (LSa), Littoral mixed sediments (LMx), Low energy infralittoral rock (LLR) and dominant habitats were identified with a coverage >15% in each sector (see figure below). Spatial variability was only considered (same value allocated to each sector in different years) and no data were available for the two upper sectors in the estuary (NA1 and NA2).
c) Hard substrata in sectors of the Humber Estuary
The occurrence of hard substrata (either pebbles or man-made vertical substratum) in the intertidal zone within each sector in the Humber Estuary was measured as % of sector length covered by such substrata. Measurements were made based on the visual inspection of aerial maps obtained from Bing, Google Map and Google Earth. Spatial variability was only considered (same value allocated to each sector in different years). Hard substrata were recognized only in sectors ND (70% hard-pebbly), NE (5% hard-pebbly, 60% hard-man made) and NF (9% hard-pebbly, 50% hard-man made).
d) Intertidal benthic invertebrate communities (total abundance and type)
The average abundance of benthic invertebrates in the intertidal habitat within each sector in the Humber Estuary was calculated based on the data reported in Allen (2006), as an indicator of the amount of potential food resources available in the intertidal area. Total benthic abundance (indiv/0.0079 m2) was given in different mid shore stations distributed across the sectors annually, from 1989 to 2003 (=13 to 15 observations per sector, as some data are missing for certain sectors in certain years). Both spatial and temporal variability was taken into account. No data were available for sectors NA1 and NA2.
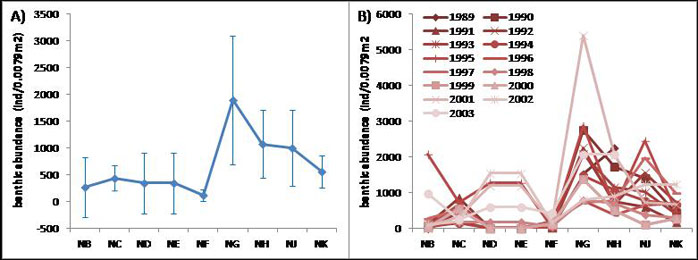
The figure below reports the resulting abundance (ind./0.0079m2) of intertidal benthic invertebrates in the WeBS sectors of the Humber Estuary calculated as average per sector (± SD) (A), or provided as annual values between 1989 and 2003 in each sector (B).
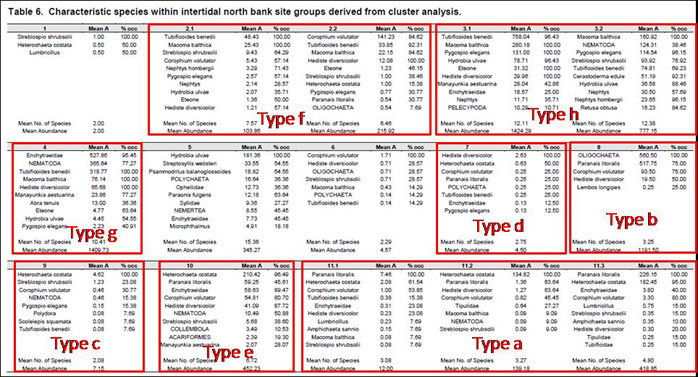
The intertidal benthic invertebrate community type within each sector in different years was also identified based on the cluster analysis given in Allen (2006), as an indicator of the variability of the type of food resources available in the intertidal area. The analysis was carried out on average density data at different stations located at mid and low shore in the northern bank of the estuary, and only stations at mid shore (giving the widest spatial and temporal coverage) were taken into account. Eight main community types (a to h) were distinguished (with a maximum similarity <40%) roughly corresponding to a gradient from inner to outer estuary and to an increase in species richness and abundance. Both spatial and temporal variability was taken into account and no data were available for sectors NA1 and NA2. The resulting characteristics species within intertidal north bank site groups derived from the cluster analysis in Allen (2006) are reported below. The main community types (considering only mid shore samples) are indicated by red boxes.
e) Disturbance
An index of the frequency of potentially disturbing activities in the sectors was calculated. Scores were given in Cruickshanks et al. (2010) to shore-based, water-based and airborne activities (overall) in each sector, ranging from 1 (Rare) to 5 (Very frequent), with also 0 values possibly allocated (Unknown occurrence/does not occur). The index of (potential) disturbance was calculated by averaging the score values in each sector. Spatial variability was only considered (same value allocated to each sector in different years). No data were available for sector NA1. The resulting average values of the Disturbance index in the WeBS sectors are shown in the figure below.
f) Wider bird population trends
An example of the data used to characterise the wider bird population trends for the Humber estuary is reported below. For this estuary, data on annual total maximum counts for Great Britain (between 1975 and 2011) were collected for selected species from WeBS books (Waterbirds in the UK Series – The Wetland Bird Survey. Published by the British Trust for Ornithology (BTO), the Royal Society for the Protection of Birds (RSPB) and the Joint Nature Conservation Committee (JNCC) in association with the Wildfowl & Wetlands Trust (WWT)). Count data were standardised by number of sites counted in the months when the maxima were recorded. The figure below reports an example of the resulting GB population trend (max annual count/site) of selected wader species (A) and wildfowl species (B). The Left vertical axis in (A) shows Dunlin data, whereas the other species are shown in the right vertical axis.
Back to top
What environmental factors should be considered in the design of a compensation scheme for waterbirds and their habitats?
What environmental variables are most important in determining minimizing or basic compensatory requirements for waterbirds?
What is important in establishing a zonation for estuaries?
What tools and guidance are available to minimise and mitigate disturbance to waterbirds?
Determinants of bird habitat use in TIDE estuaries
Table of content
- 1. SUMMARY
- 2. INTRODUCTION
- 3. STRUCTURE OF THE REPORT
- 4. DATA USED
- 5. GENERAL CHARACTERISTICS OF BIRD ASSEMBLAGES IN TIDE ESTUARIES
- 6. BIRD ASSEMBLAGES DISTRIBUTION AND RELATIONSHIP WITH ENVIRONMENTAL VARIABLES
- 6a. Humber
- 6b. Weser
- 6c. Elbe
- 7. SPECIES DISTRIBUTION MODELS
- 7a. Dunlin
- 7b. Redshank, Golden Plover and Bar-tailed Godwit
- 7c. Shelduck, Pochard and Brent Goose
- 8. DISCUSSION
- 9. CONCLUSIONS
- 9a. Analysis Conclusions
- 9b. Management Recommendations
- 9c. Recommendations for Future Studies
- 10. REFERENCES
- 11. APPENDIX 1
- 12. APPENDIX 2
- 13. APPENDIX 3
- 14. APPENDIX 4
11. Appendix 1
Environmental data used for the Humber Estuary - additional details
a) Calculation of habitat areas (km2) in counting units over time based on historical habitat maps.Habitat areas were measured in each estuary in selected years based on available historical habitat maps. Habitat maps for the years 1975, 1993 and 2008 were obtained for the Humber through the digitisation of Admiralty Charts, using bathymetry levels to distinguish subtidal, intertidal and supratidal habitats (in this case habitat maps did not cover the two upper sectors, NA1 and NA2). Maps for 1950 and 1995 were used for the Elbe and 1950 and 2000 maps were obtained for the Weser. A monotonous linear decrease/increase of the area of each habitat between these years was considered and the habitat area was calculated accordingly for the missing years, extending the calculation to a maximum of 3 years after the year of the last available habitat map.
An example of this calculation for sector NB in the Humber Estuary is reported below. Dashed black lines indicate the habitat data derived with direct measure from historical habitat maps (in this case, available for the years 1975, 1993 and 2008).
b) Dominant intertidal habitat type
The dominant intertidal habitat type present within WeBS sectors was identified based on the EUNIS 3 habitat map given in Hemingway et al. (2008) and on the % coverage of these habitats in each sector. EUNIS 3 habitats included Littoral mud (LMu), Littoral sand (LSa), Littoral mixed sediments (LMx), Low energy infralittoral rock (LLR) and dominant habitats were identified with a coverage >15% in each sector (see figure below). Spatial variability was only considered (same value allocated to each sector in different years) and no data were available for the two upper sectors in the estuary (NA1 and NA2).
c) Hard substrata in sectors of the Humber Estuary
The occurrence of hard substrata (either pebbles or man-made vertical substratum) in the intertidal zone within each sector in the Humber Estuary was measured as % of sector length covered by such substrata. Measurements were made based on the visual inspection of aerial maps obtained from Bing, Google Map and Google Earth. Spatial variability was only considered (same value allocated to each sector in different years). Hard substrata were recognized only in sectors ND (70% hard-pebbly), NE (5% hard-pebbly, 60% hard-man made) and NF (9% hard-pebbly, 50% hard-man made).
d) Intertidal benthic invertebrate communities (total abundance and type)
The average abundance of benthic invertebrates in the intertidal habitat within each sector in the Humber Estuary was calculated based on the data reported in Allen (2006), as an indicator of the amount of potential food resources available in the intertidal area. Total benthic abundance (indiv/0.0079 m2) was given in different mid shore stations distributed across the sectors annually, from 1989 to 2003 (=13 to 15 observations per sector, as some data are missing for certain sectors in certain years). Both spatial and temporal variability was taken into account. No data were available for sectors NA1 and NA2.
The figure below reports the resulting abundance (ind./0.0079m2) of intertidal benthic invertebrates in the WeBS sectors of the Humber Estuary calculated as average per sector (± SD) (A), or provided as annual values between 1989 and 2003 in each sector (B).
The intertidal benthic invertebrate community type within each sector in different years was also identified based on the cluster analysis given in Allen (2006), as an indicator of the variability of the type of food resources available in the intertidal area. The analysis was carried out on average density data at different stations located at mid and low shore in the northern bank of the estuary, and only stations at mid shore (giving the widest spatial and temporal coverage) were taken into account. Eight main community types (a to h) were distinguished (with a maximum similarity <40%) roughly corresponding to a gradient from inner to outer estuary and to an increase in species richness and abundance. Both spatial and temporal variability was taken into account and no data were available for sectors NA1 and NA2. The resulting characteristics species within intertidal north bank site groups derived from the cluster analysis in Allen (2006) are reported below. The main community types (considering only mid shore samples) are indicated by red boxes.
e) Disturbance
An index of the frequency of potentially disturbing activities in the sectors was calculated. Scores were given in Cruickshanks et al. (2010) to shore-based, water-based and airborne activities (overall) in each sector, ranging from 1 (Rare) to 5 (Very frequent), with also 0 values possibly allocated (Unknown occurrence/does not occur). The index of (potential) disturbance was calculated by averaging the score values in each sector. Spatial variability was only considered (same value allocated to each sector in different years). No data were available for sector NA1. The resulting average values of the Disturbance index in the WeBS sectors are shown in the figure below.
f) Wider bird population trends
An example of the data used to characterise the wider bird population trends for the Humber estuary is reported below. For this estuary, data on annual total maximum counts for Great Britain (between 1975 and 2011) were collected for selected species from WeBS books (Waterbirds in the UK Series – The Wetland Bird Survey. Published by the British Trust for Ornithology (BTO), the Royal Society for the Protection of Birds (RSPB) and the Joint Nature Conservation Committee (JNCC) in association with the Wildfowl & Wetlands Trust (WWT)). Count data were standardised by number of sites counted in the months when the maxima were recorded. The figure below reports an example of the resulting GB population trend (max annual count/site) of selected wader species (A) and wildfowl species (B). The Left vertical axis in (A) shows Dunlin data, whereas the other species are shown in the right vertical axis.
Important to know
Reports / Measures / Tools
| Report: | Management measures analysis and comparison |
|---|
Management issues
How can management targets and monitoring strategies be set for waterbirds in compensatory areas?What environmental factors should be considered in the design of a compensation scheme for waterbirds and their habitats?
What environmental variables are most important in determining minimizing or basic compensatory requirements for waterbirds?
What is important in establishing a zonation for estuaries?
What tools and guidance are available to minimise and mitigate disturbance to waterbirds?


