
Disclaimer:
The authors are solely responsible for the content of this report. Material included herein does not represent the opinion of the European Community, and the European Community is not responsible for any use that might be made of it.
Back to overview reports
Chlorinity (fig. 13) intrudes up the furthest in the Elbe estuary, next in the Scheldt estuary and least in the Weser estuary. The Elbe estuary has a very extended freshwater zone (0-91 km). The maximum chlorinity (Attachment 2 ) for Elbe, Scheldt and Humber lay more or less in the same range, indicating a similar estuarine gradient is considered for data comparison (17 800 ± 151.4 mg CL/l; 17 929,3 ± 247.9 mg CL/l; 21 319 ± 426.8 mg CL/l; respectively). For the Weser there are mostly three sampling stations during the time period studied in TIDE, of which two are located in the freshwater zone.
Overall the whole estuarine gradient, pH (Attachment 2 ) is observed to be highest within the Elbe estuary (8.0 ± 0.01) and lowest within the Humber estuary (7.78 ± 0.01). Difference between summer and winter is most pronounced within the Elbe estuary (pHsummer – pHwinter = 0.11), next within the Scheldt estuary (0.08). In the Humber there is no difference in pH between summer and winter. In all estuaries pH is high within the freshwater zone, decreases in the oligohaline zone and again increases towards the polyhaline zone.
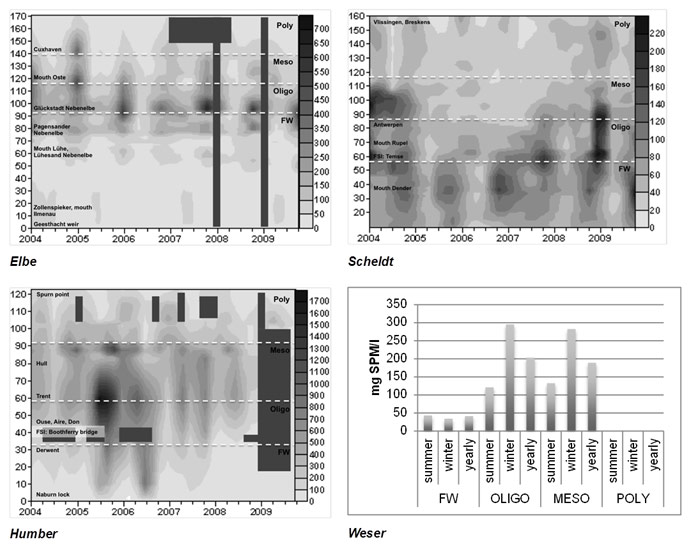
Suspended particulate matter (Attachment 2 ) is clearly the highest within the Humber estuary (on average 268.1 ± 18.1 mg/l; maximum 2082.0 mg/l). The lowest values can be observed within the Scheldt estuary (65.3 ± 2.0 mg/l). In general suspended matter concentrations appear to be higher in winter than in summer for the Elbe, Scheldt and Weser estuary (SPMwinter - SPMsummer = 75.8; 28.4 & 31.9 mg/l resp.). In the Humber summer concentrations are slightly higher than in winter, showing a reverse pattern. However, the difference between summer and winter is less pronounced than for the other estuaries (SPMwinter - SPMsummer = -24.2 mg/l). In the Elbe suspended matter concentrations seem to increase towards the oligohaline zone and decrease again towards the freshwater zone. In the Humber highest suspended matter concentrations usually can be found along the stretch of the oligo- and mesohaline zone. Also in the Weser highest concentrations are observed within the oligo- and mesohaline zone. Within the Scheldt the highest concentrations are often observed within the freshwater zone, sometimes also within the oligohaline stretch (fig. 14). Estuarine patterns are clearly different.
Based upon suspended matter concentrations, euphotic depth can be estimated and compared with bathymetrical depth. Bathymetrical depth can be considered as mixing depth in well-mixed macro-tidal estuaries. In general euphotic depth is highest in the polyhaline and next, the freshwater zone of all estuaries. Within the Elbe it can be observed that as mixing depth increases, euphotic depth clearly decreases (fig. 15) and although deeper, that towards the polyhaline zone euphotic depth is increasing again. From all four estuaries, euphotic depths are highest in the polyhaline and freshwater zone of the Elbe (1.4 m and 1.2 m resp.). However, self-shading effects of algae are not considered in the formula that is used to deduce euphotic depth (see ‘2 Material and Methods’ ). Within the Scheldt estuary, euphotic depth is lower within the oligohaline zone than in the freshwater zone (even more pronounced in winter). From the oligohaline zone towards the mesohaline zone, euphotic depth abruptly increases again. Within the Humber, euphotic depth rapidly decreases from the upper boundary into the freshwater zone up to polyhaline zone. It is not until the end of the polyhaline zone that euphotic depth is increasing again. Euphotic depths are observed to be lowest in the Humber estuary (0.2 m in the oligohaline zone). Within in the Weser to few data points are monitored to really see a trend in euphotic depth with mixing depth (fig. 15).
Euphotic depth, mixing depth ratios taking a six-yearly average on a yearly, summer and winter basis are in general highest in the freshwater zone. Fig. 16 reveals that ratios are highest in the freshwater zone of the Scheldt estuary (0.49). Ratios are lowest within the oligohaline zone of the Elbe (0.02) and mesohaline zone of the Humber (0.01). Even within the Elbe freshwater zone (FW3) ratios are very low (0.04), because of the very large bathymetrical depth. Differences between winter and summer are relatively limited (fig. 16).
Correlations found in almost all estuaries, include dissolved oxygen with temperature and suspended matter concentration with total phosphorus. Dissolved oxygen and temperature are correlated by physics, since less oxygen can dissolve with increasing temperature. Absence of this physically regulated correlation larger than 0.50 within the Scheldt estuary might indicate the larger importance of other oxygen influencing processes over the physical ones compared to the other estuaries in TIDE. The correlation between suspended particulate matter and total phosphate in the Elbe, Scheldt and Weser, while there is a lack of correlation between suspended matter and phosphate in these estuaries, show that a large part of suspended particulate matter consists out of organic phosphorus. This correlation presumably also exist within the Humber estuary, as can be seen from the phosphate dynamics (see further); however total phosphorus was not measured within this estuary. Correlation is less pronounced in the Scheldt estuary. Further correlation with organic carbon compounds with suspended matter was also only found within the Elbe and Weser. In the Humber no organic carbon compounds were measured during the six-year period studied.
Furthermore, some characteristic correlations per estuary could be found. In the Scheldt there was a clear negative correlation of dissolved constituents (dissolved organic carbon, nitrate, phosphate, …) with chlorinity. In the Elbe estuary there is a clear correlation between chlorophyll a, biological oxygen demand and phaeopigments, likely indicating that chlorophyll a represents a large part of the organic matter input within the estuary. The Weser and Humber strongest correlations mostly reflect physical ones, such as between temperature and dissolved oxygen.
A more extensive and equilibrated examination of estuarine functioning per zone and season in different estuaries was performed using a multivariate analysis technique, principal component analysis. Data is needed for all zones and seasons. Since for the Weser only data was available from 2004 to 2009 for mostly the freshwater and oligohaline zone, the Weser could not be further included in this analysis. Shared data between the Elbe, Scheldt and Humber include the following 13 variables: temperature, chlorinity, pH, suspended particulate matter, dissolved oxygen, dissolved oxygen saturation, nitrate, nitrite, total dissolved inorganic nitrogen, ammonium, phosphate, dissolved silica and chlorophyll a (however, chlorophyll data in the Humber represents chlorophyll extract and not chlorophyll a data; nevertheless it should indicates its importance in this type of analysis). Because of data gaps, only the years 2004 to 2006 could be included in the analysis.
Spatial and temporal differences of physic-chemical processes per estuary
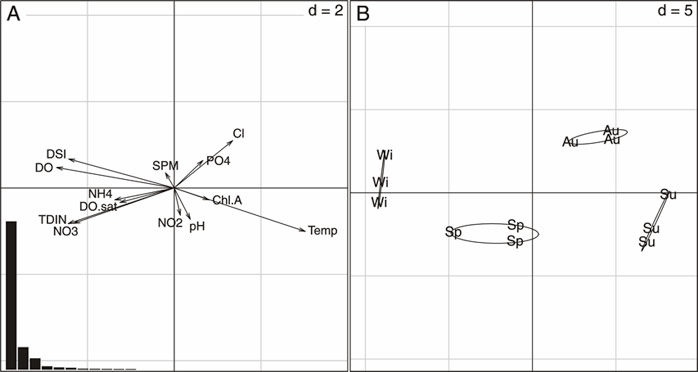
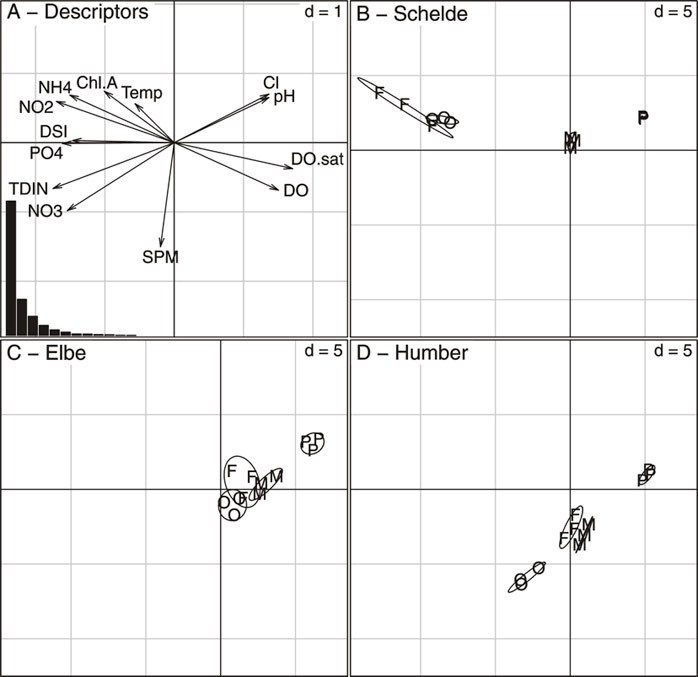
In a first step, three separate principal component analyses per estuary were performed (fig.17). For all three estuaries a clear upstream-downstream gradient from the freshwater to the polyhaline zone can be found. The freshwater is characterized by high nutrient concentrations, decreasing gradually towards the polyhaline zone. The polyhaline zone on the contrary is characterized by high pH values and high dissolved oxygen concentrations (fig. 17; A-C & D-F). Furthermore, also the opposition between winter and summer season is clearly displayed for all three estuaries (fig. 17; G-I). However, the physico-chemical processes defining this seasonality, differ markedly between estuaries. In the Scheldt winter to summer seasonality is defined by increasing temperature and chlorophyll a concentrations, meanwhile in the Elbe winter to summer seasonality is defined by increasing phosphate concentrations and decreasing chlorophyll a concentrations. In the Humber estuary the winter to summer seasonality is mostly defined by an increase in temperature and a decrease in ammonium (fig. 17; A-C & G-I).
Between analyses per estuary reveal that the most significant structuring factor is salinity, next seasonality (fig. 18; p<0.01). For the three years examined, no significant year effect could be found for any of the estuaries.
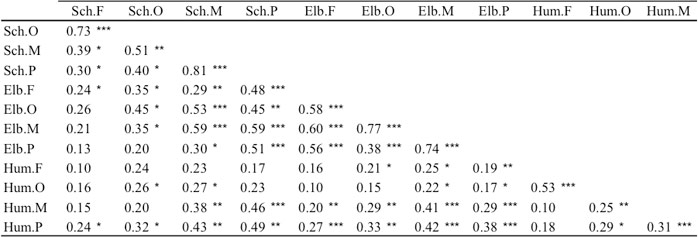
To further examine how zones differ from each other in physico-chemical processes for the different estuaries, a partial triadic analysis has been performed. Respectively to each zone, a table is defined by the physico-chemical descriptors measured three times (2004-2006) during the four seasons (season-year in lines × descriptor in columns). Next, correlations are made between all estuarine zones. The correlation matrix (table 4) and circle (fig. 19) between estuarine zones exhibits a majority of significant Rv coefficients, indicating that many of them share similar seasonal patterns of processes. Most differences with respect to the other estuarine zones are to be found in the freshwater and oligohaline zones of the Scheldt and Humber estuaries.
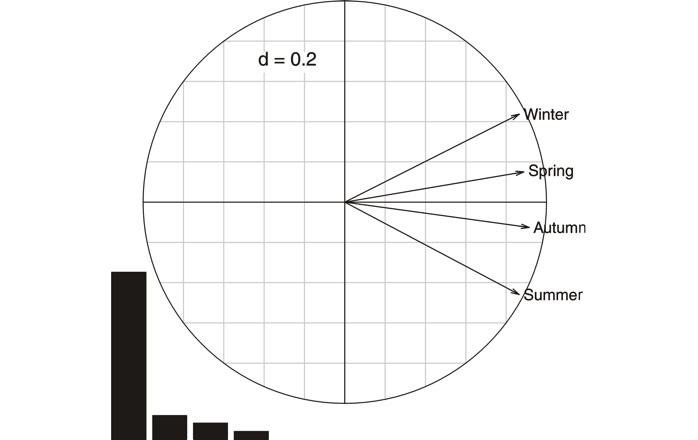
The average estuarine pattern that can be found from this analysis is represented in the compromise structure (fig. 20). The first axis reflects the opposition between winter and summer. Summer is characterized by high temperatures and salinities. Winter rather shows high dissolved silica, dissolved oxygen, total dissolved inorganic nitrogen and nitrate concentrations.
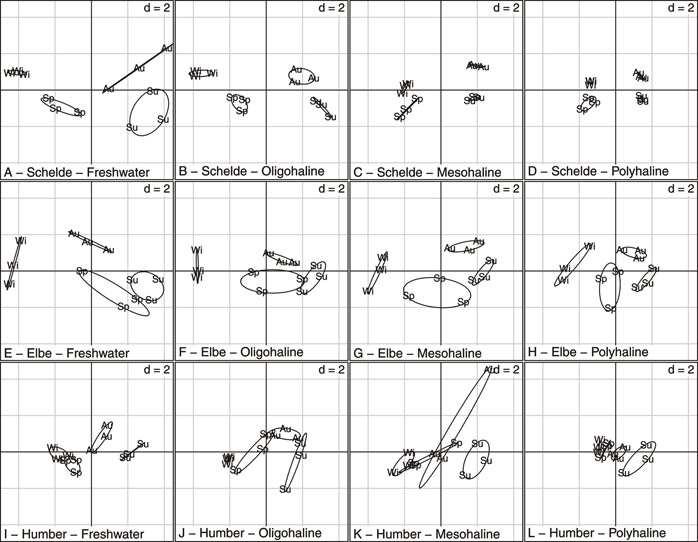
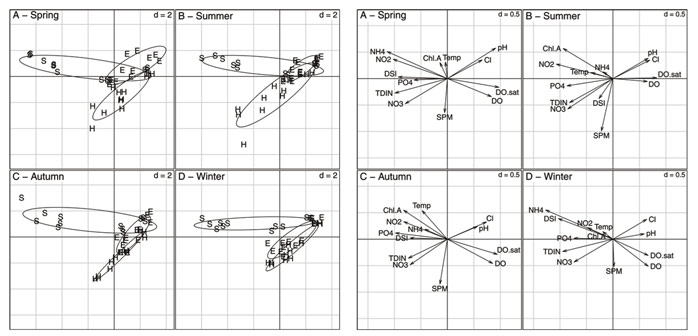
In the intrastructure, distinct seasonal (fig. 21) and physico-chemical (fig. 22) patterns for the Scheldt and Humber estuaries become clear. The Humber estuary is marked by high suspended matter concentrations in summer and autumn, and absence of seasonal variations in chlorophyll a and dissolved silica concentrations in the low salinity zones (fig. 21; I-L & fig. 22; I-L). The Scheldt freshwater zone mainly differs from the Elbe by its peak of primary production, occurring rather in autumn than in spring (fig. 21; A-D & fig. 22 A-D). A general remarkable aspect that can be observed between zones within an estuary is the decrease in seasonal amplitude of the physico-chemical processes in the polyhaline zone. Only within the Scheldt estuary, this decrease can be observed to be gradual along the estuarine gradient (fig. 22; A-D).
To further study how seasons differ from each other in physico-chemical processes between zones, a similar (partial triadic) analysis has been performed. However, now for each season, a table is defined by the physico-chemical descriptors measured three times (2004-2006) for the four different spatial units (zone-year lines × descriptors in columns). Again a correlation matrix (table 5) and circle (fig. 23) are created, but this time displaying correlations between seasons for an average estuarine pattern.
All Rv coefficients are significant (table 5), indicating similar patterns for all seasons. Nevertheless, the winter-spring and summer-autumn opposition can be seen from the correlation circle (fig. 23).
Again, from the compromise it is clear that the upstream parts of Scheldt and Humber (freshwater and oligohaline zone resp.) are most distinct from the other estuarine spatial units (fig. 24).
Although Rv coefficients are significant, from the intrastructure it can be observed that estuarine patterns between zones are most alike for all seasons in the Elbe. In the Humber differences in estuarine patterns between zone decrease in winter, while in the Scheldt a distinction between zones persists throughout the seasons (fig. 25). In all estuarine zones and seasons dissolved constituents (nitrogen species, phosphate) decrease and pH and dissolved oxygen concentrations increase with chlorinity increasing. Ammonium concentrations decrease with increase in temperature and chlorophyll a in summer and autumn, mostly in the Scheldt. The Humber differentiates itself from the other estuaries by its low dissolved silica concentrations and absence of chlorophyll dynamics in summer. The Elbe differentiates itself from the other estuaries by its lower nutrient concentrations in general (fig. 25).
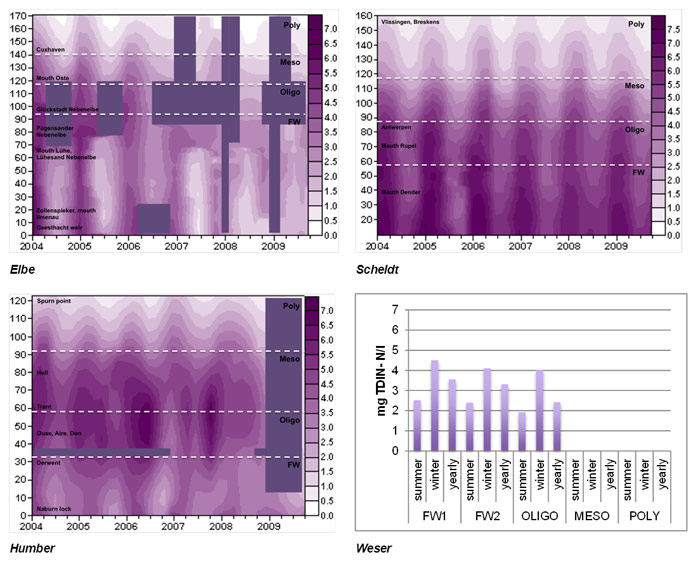
Total dissolved inorganic nitrogen concentrations (fig. 26) do not change drastically for the time period studied. However, we can see clearly different spatial patterns for the Elbe, Scheldt and Humber estuaries. The spatial distribution of the Weser could not be considered because total dissolved inorganic nitrogen was measured in only three, occasionally four sampling stations, within the freshwater, oligohaline and sometimes the polyhaline zone. The concentrations however, seem to be in the same order of magnitude then those for the Elbe estuary.
The concentrations of total dissolved inorganic nitrogen (Attachment 2 ) averaged over the six-year period studied, are highest within the Scheldt estuary (4.2 ± 0.09 mg N/l) and lowest within the Elbe estuary (3.0 ± 0.08 mg N/l). The highest concentrations in the Elbe, Scheldt, Humber and Weser are observed in the oligohaline, freshwater, oligohaline and freshwater zone respectively. In the Scheldt a gradual decrease towards the sea can be observed, while in the Elbe and Humber local peaks and valleys are displayed (fig. 26). In all estuaries total dissolved inorganic nitrogen concentrations are highest in winter (Attachment 2 ). The six-yearly average difference between winter and summer concentration for the zone of highest total dissolved nitrogen concentration per estuary is observed to be highest within the Elbe estuary (2.73 mg N/l), next the Weser estuary (2.01 mg N/l) and the Scheldt estuary (1.88 mg N/l) and lowest within the Humber estuary (0.05 mg N/l). However, taking into account the missing data in the Elbe estuary, this summer winter difference is likely to be higher in the freshwater zone than the oligohaline zone.
To understand these different patterns, a closer study of ammonium and nitrate concentrations (see further) is performed, the two species mostly involved within biogeochemical processing for nitrogen. Besides concentrations, also deviations from the expected concentrations due to conservative mixing are considered here. This gives insight into the sink and source function per zone. Unfortunately sink and source functions could not be studied for the Weser estuary, since not enough data were available along the estuarine salinity gradient to apply this method.
Nitrate and ammonium dynamics
In general, along the overall estuarine gradient, highest average nitrate concentrations (Attachment 2 ) are reached in the Scheldt and Humber estuary (3.67 ± 0.07 mg N/l and 3.67 ± 0.10 mg N/l resp.). Lowest average nitrate concentrations can be observed in the Elbe estuary (2.60 ± 0.05 mg N/l). In both Scheldt and Elbe nitrate concentrations appear to decrease towards the sea. In the Humber concentrations seem to reach a maximum along the oligo- to mesohaline stretch (fig. 27). Nitrate concentrations are also highest in winter within the same zones as observed for total dissolved inorganic nitrogen (see earlier). The six-yearly average difference between winter and summer concentration for the zone of highest nitrate concentration per estuary is observed to be highest within the Elbe estuary (2.25 mg N/l), next the Weser estuary (1.92 mg N/l) and the Scheldt estuary (0.87 mg N/l) and lowest within the Humber estuary (0.20 mg N/l). Considering the surfer plots of gain and loss of observed nitrate concentration relative to the expected concentration due to mixing, in Elbe and Scheldt gain and loss seem to alternate along the estuarine gradient, while in the Humber there are clear patches of nitrate gain and loss displayed (fig. 27).
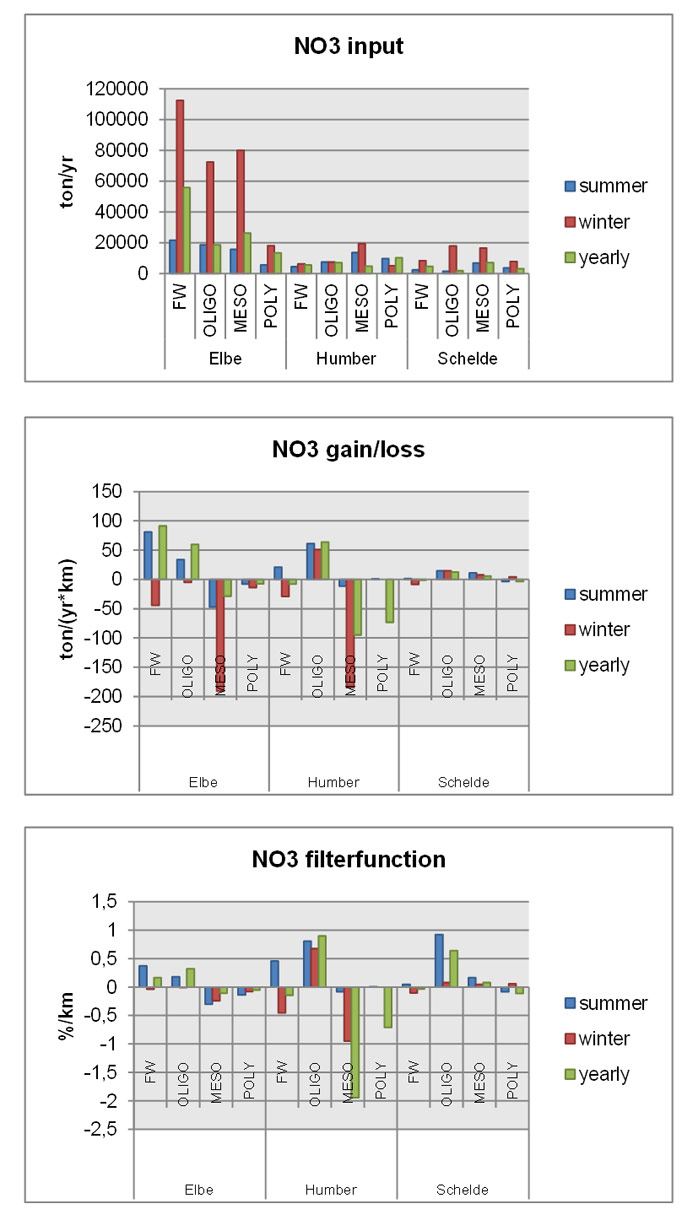
Gain and loss multiplied with freshwater discharge, averaged per zone for the six-year period studied on a yearly basis (fig. 28) shows that most nitrate is gained within the freshwater zone of the Elbe estuary (91 ton N/yr*km) and least nitrate is gained within the freshwater zone of the Scheldt (1 ton N/yr*km). Nitrate loss is highest within the mesohaline zone of the Humber estuary (-95 ton N/yr*km). In general, in summer there is a tendency for nitrate gain, while in winter there is rather nitrate loss. Except for the oligohaline zone of the Humber, and all zones from the oligohaline zone towards the sea in the Scheldt, where there is nitrate gained in both summer and winter. Taking into account the input concentration, as the concentration of the most upstream point per zone, one can have an idea of the filter efficiency per zone, by dividing gain or loss by its input. On a yearly basis, nitrate is most efficiently removed within the mesohaline zone of the Humber estuary (-1.94 %/km). However, nitrate is also mostly produced within the same estuary, within the oligohaline zone (+ 0.90 %/km). Whether it concerns gain or loss, the filter appears to be more competent in summer than in winter, except for the mesohaline zone of the Humber estuary, in which nitrate is more efficiently removed in winter.
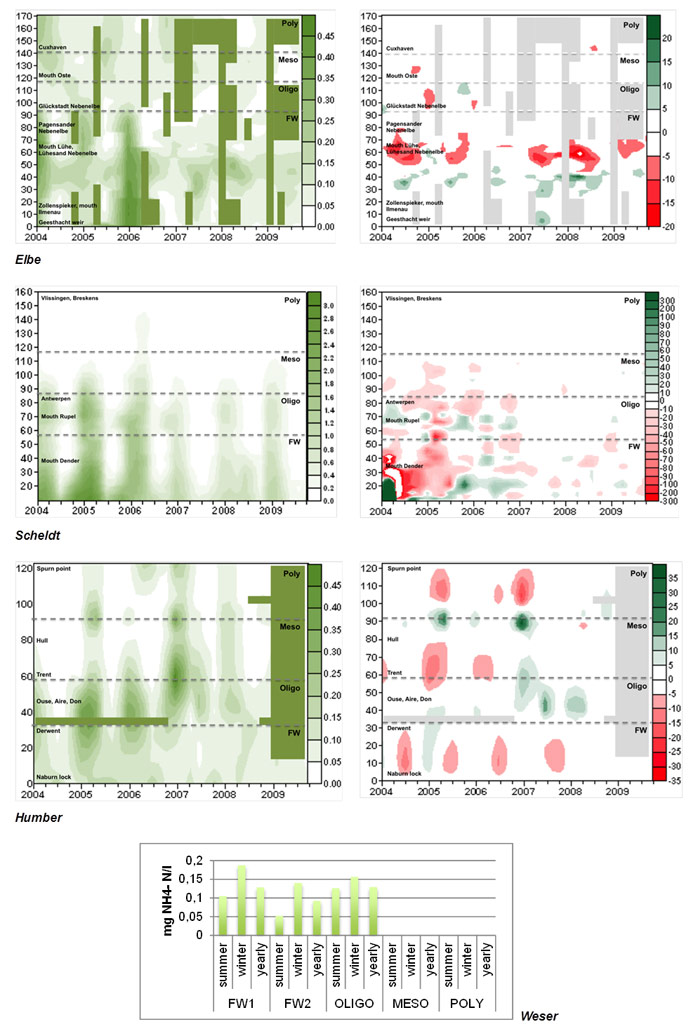
Like for nitrate, also highest ammonium concentrations (Attachment 2 ) as observed in general, along the overall estuarine gradient can be found within the Scheldt estuary (0.44 ± 0.03 mg N/l), having their maximum within the freshwater zone (0.82 ± 0.05 mg N/l) and next gradually decreasing towards the sea (fig. 29). The difference between the estuaries is much more strikingly for ammonium than for nitrate. Even though ammonium concentrations have decreased most pronounced within the Scheldt estuary (fig. 29), six-yearly averaged concentrations are about three times higher than within the Elbe, Weser and Humber estuaries (Attachment 2 ). Although, in the Elbe there is quite a lot of data missing in time and space, it seems concentrations are highest within the freshwater zone (0.14 ± 0.01 mg N/l). Noteworthy are the high concentrations observed in 2006 (fig. 29). In the Humber estuary, ammonium concentrations are higher within the oligohaline zone (0.14 ± 0.02 mg N/l). However, study of the surfer plot shows there is a second peak more downstream at the border of the meso- and polyhaline zone. Furthermore, it appears that the first peak of ammonium within the oligohaline zone shifted more downstream to the mesohaline zone from 2006 to 2007 (fig. 29). In the Weser estuary highest ammonium concentrations can be observed within the oligohaline zone (0.13 ± 0.01 mg N/l). However, it has to be noticed only limited data for the Weser was available (n = 21). Again concentrations for ammonium are like for nitrate higher in winter than in summer. The difference between winter and summer for the zone of maximum concentration is highest within the Scheldt estuary (1.05 mg N/l), followed by the Humber (0.16 mg N/l), Elbe (0.13 mg N/l) and Weser estuaries (0.03 mg N/l).
Compared with nitrate mixing plots, ammonium mixing plots seem to be more defined by distinct zones of gain and loss (fig. 29).
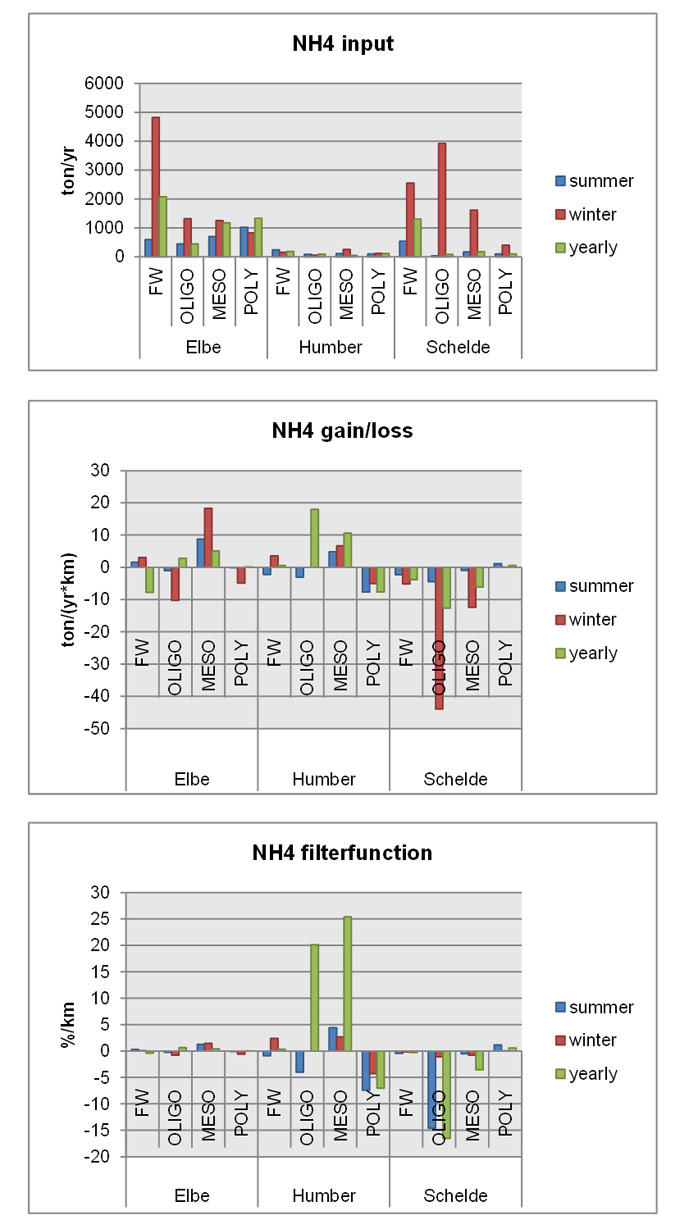
Based upon a six-yearly average, gain of ammonium is highest within the oligohaline zone of the Humber estuary (18 ton N/ yr*km), loss is highest within the oligohaline zone of the Scheldt estuary (-13 ton/yr*km) (fig. 30). Within the Scheldt ammonium is lost in both winter and summer season and on a yearly basis along almost the whole estuarine gradient. Loss is most pronounced during winter season. Within the Humber ammonium is lost in winter and gained in summer. On a yearly basis, ammonium is produced within the Humber along the whole estuarine gradient (fig. 30), despite large patches of ammonium loss observed in the freshwater, meso- and polyhaline zone (fig. 29). Within the Elbe ammonium is gained within the freshwater zone, while lost in the other zones (fig. 30). Considering also the input into every zone, ammonium is gained mostly within the Humber estuary within the oligo- and mesohaline zone, while being most efficiently removed within the oligohaline zone of the Scheldt estuary. Either gain or loss is effectively limited in the Elbe estuary, or ammonium gain is immediately balanced by loss (e.g. ammonium from organic matter mineralization is immediately nitrified) (fig. 30).
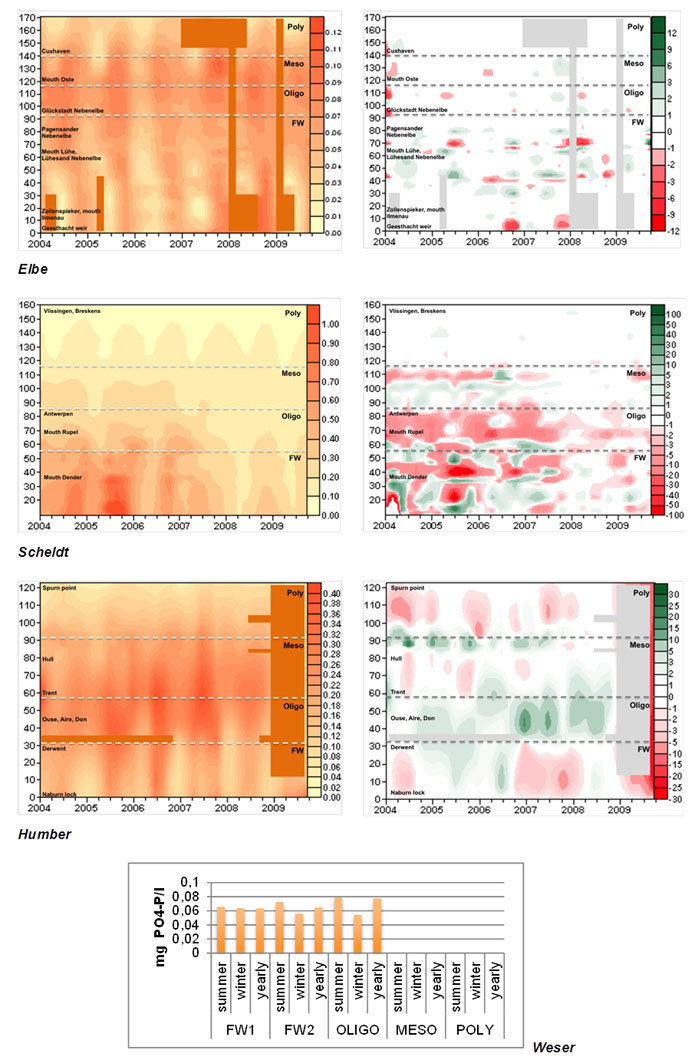
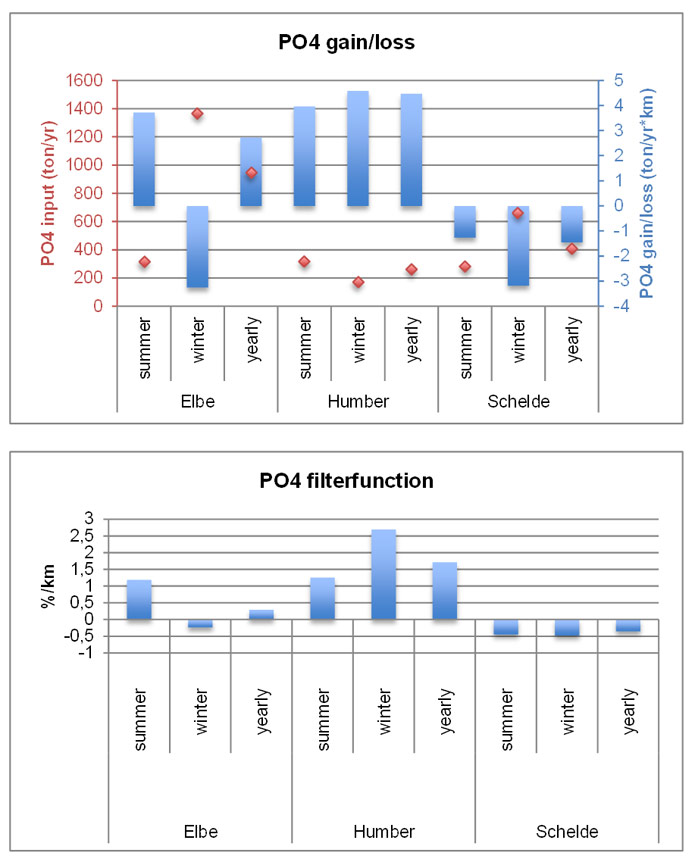
On a yearly basis, phosphate is gained most within the oligo- and mesohaline zone of the Humber estuary (10 ton/yr*km) and lost most within the oligohaline zone of the Scheldt estuary (-2 ton/yr*km). Usually, losses are higher in winter than in summer for all estuaries, except for the oligohaline zones of the Elbe and Humber estuaries, in which phosphate is gained more during winter than during summer. In general phosphate is lost along the whole estuarine gradient of the Scheldt and gained along most of the estuarine gradient of the Humber (fig. 32). Taking into account input concentrations per zone, phosphate is mainly lost within the upstream parts of the Scheldt estuary and produced within the middle part of the Humber estuary. Dynamics are clearly lower within the Elbe estuary (fig. 32).
The method to calculate gain and loss could only be applied upon the Scheldt and Elbe estuary. In both estuaries clear patches of gain and loss can be distinguished (fig. 33).
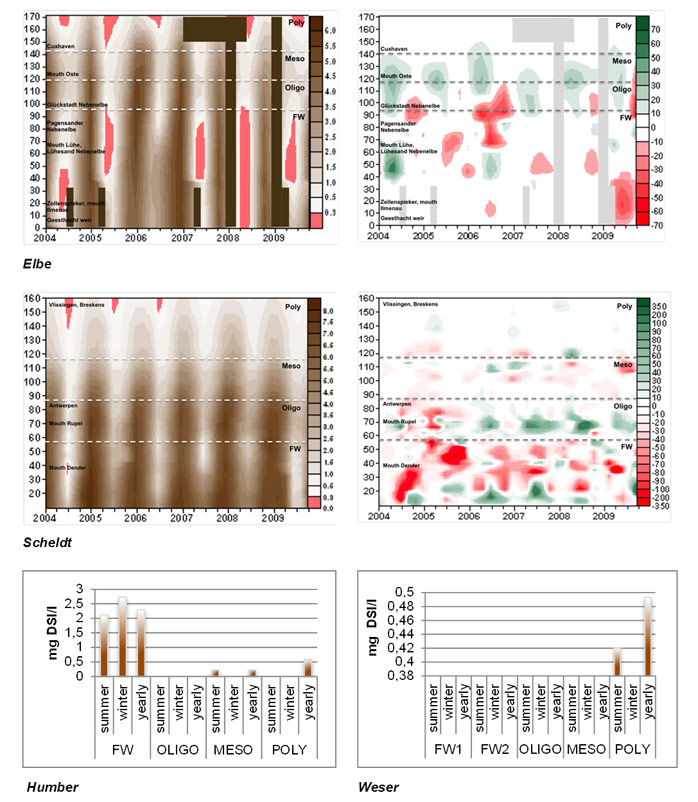
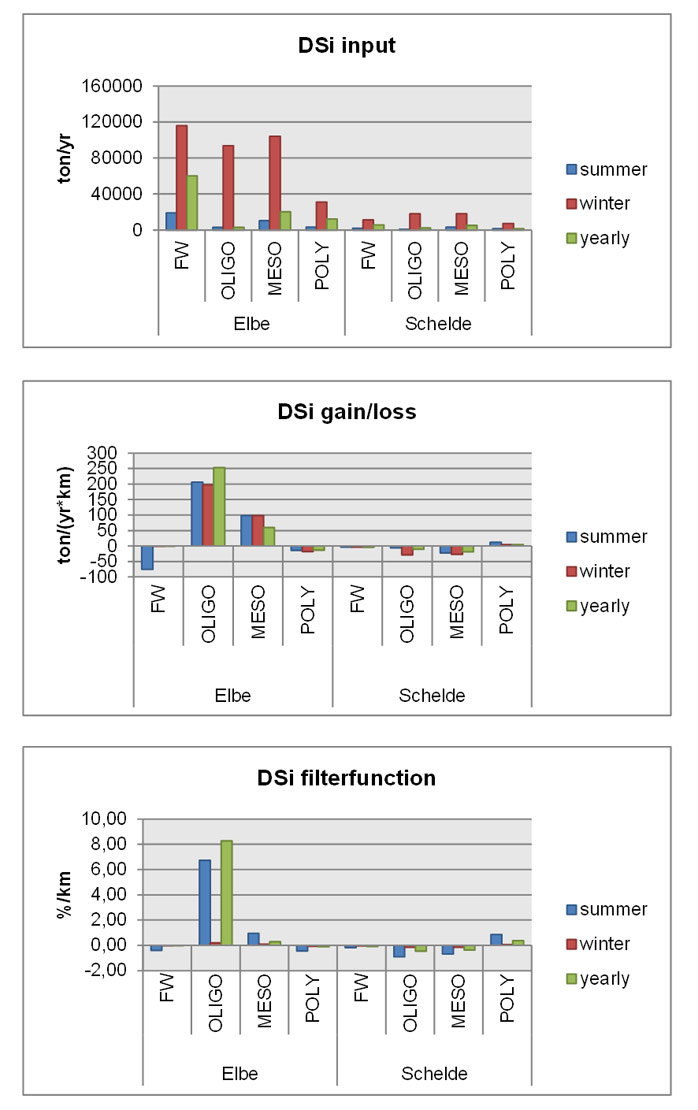
In the Elbe dissolved silica is gained within the mid part of the estuary. In the Scheldt dynamics are limited and rather a small loss of dissolved silica can be observed in the mid-estuarine part. Taking input concentration per zone into account, only within the oligohaline part of the Elbe estuary a clear increase of dissolved silica can be seen (8.27 %/km). Mostly there is not that much difference between gain and loss in summer and winter (fig. 34). However, when looking at the mixing plots, it can be noted that dissolved silica is gained in winter and lost in summer (fig. 34).
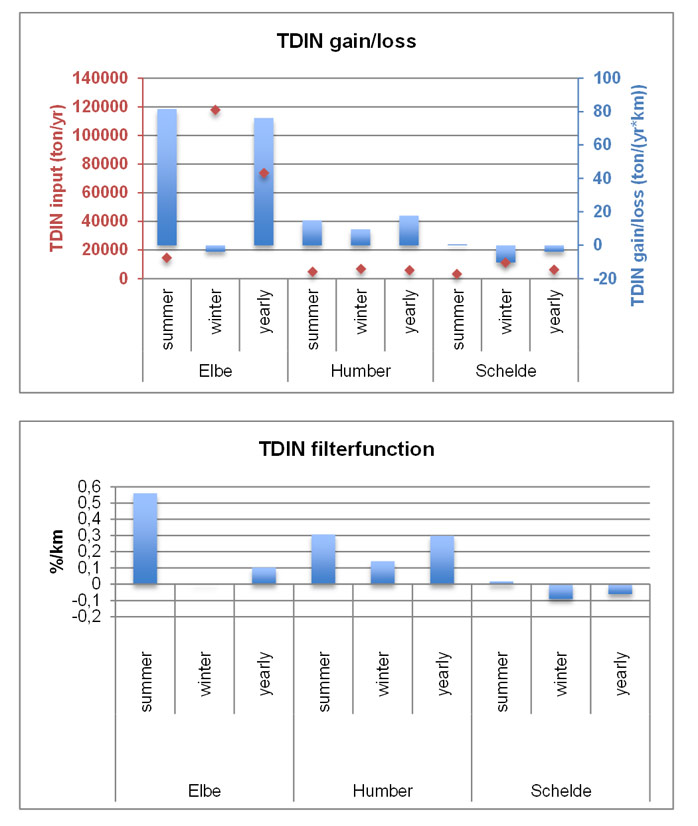
Averaging gain and loss along the whole estuarine length for Elbe, Scheldt and Humber shows that the Elbe is exporting the most amount of inorganic nitrogen (76 ton/yr*km), while most is removed within the Scheldt estuary (-3 ton/yr*km). In the Humber nitrogen is also exported on a yearly basis (18 ton/yr*km). Nitrogen loss appears to be high in winter, while gain is rather high in summer (fig. 35). Taking the starting concentration into account, total dissolved inorganic nitrogen gain has more effect upon the Elbe and Humber estuaries, than removal has upon the Scheldt estuary (fig. 35).
Nitrogen input
Nitrogen import (fig. 36) in the Elbe estuary is obviously the highest compared with the other estuaries (78 kton/yr, nitrate ammonium and organic nitrogen combined). Also much organic nitrogen is mainly imported in the Elbe. Next, much nitrogen is imported in the Weser estuary (47 kton). Input seems to be lowest within the Scheldt estuary. At the Rupel, nitrogen import in the Scheldt is clearly elevated. Import is highest in winter. Difference between winter and summer import is highest in the Weser and within the Scheldt near the Rupel (3.7 and 3.3 times more input in winter, respectively). Difference is lowest in the Humber estuary (only 10 % more input in winter).
Estuarine processing
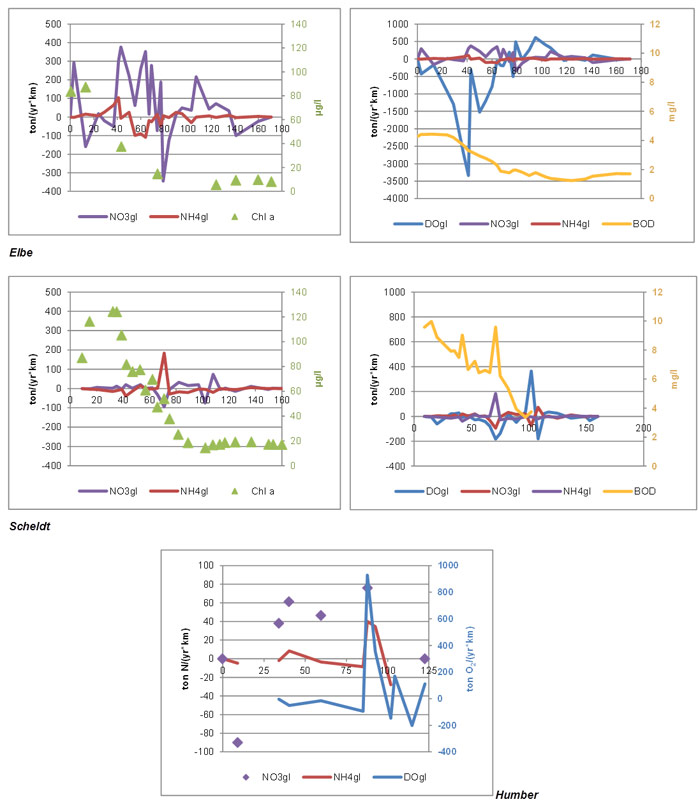
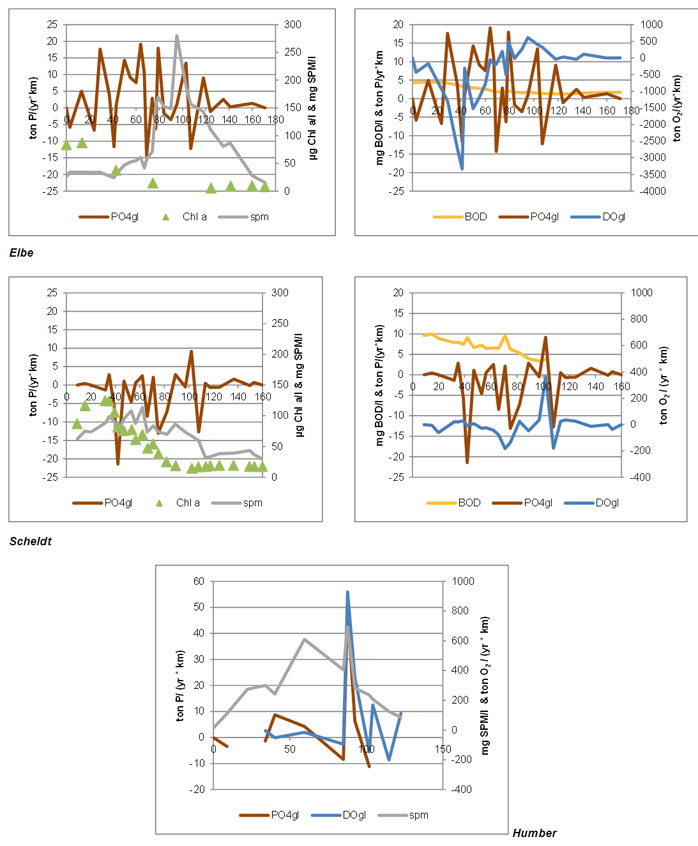
Ammonium and nitrate are successively gained in the freshwater zone of the Elbe estuary. As biological oxygen demand decreases towards the sea, also gain and loss dynamics for nitrogen seem to decrease. As biological oxygen demand decreases, probably more organic matter is mineralized to ammonium, which is further nitrified to nitrate, explaining the successive gain of ammonium and nitrate. Chlorophyll a concentrations measured, are highest in the freshwater zone, but seem not to be very clear correlated with nitrogen dynamics. It appears biological oxygen demand as indicator for organic matter and ammonium input is the main indicator for nitrogen dynamics. A peak of nitrate gain can be observed near the mouth of the Lühe, while a peak of nitrate loss can be observed near Pagensander Neben Elbe shallow water zone (fig. 37).
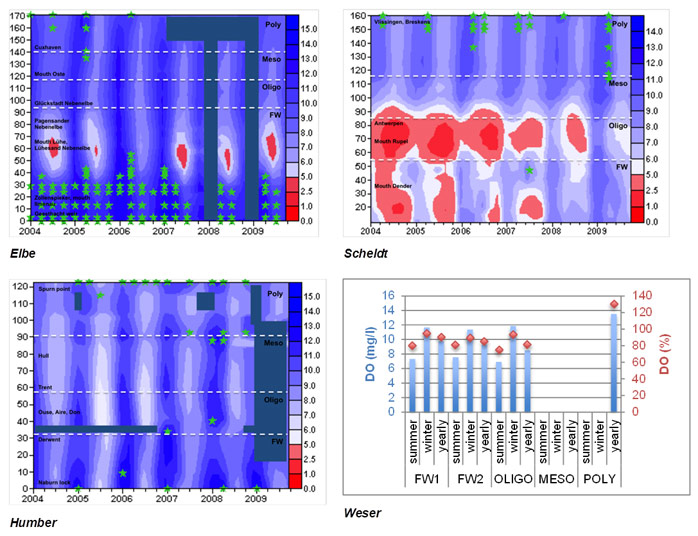
In the Scheldt, also chlorophyll a concentrations are very high in the freshwater. However, again there is not a very clear correlation with nitrogen dynamics. In general they are higher than within the Elbe estuary. Most nitrogen gain and loss occurs near the mouth of the Rupel. A clear peak of ammonium gain coincides with a peak of nitrate loss. Near the Rupel also a peak of oxygen loss and a peak of biological demand is observed. It would be expected that ammonium gained from organic matter mineralization is further nitrified to nitrate, giving a peak of nitrate gain. However, a peak of nitrate loss is observed indicating nitrate removal. Together with the low oxygen concentrations observed near the Rupel (see fig. 44, further), it is likely a zone of coupled nitrification-denitrification can be found in the pelagic here. Oxygen and biological oxygen demand again show to be the main indicators for nitrogen dynamics (fig. 37). At the border between Belgium and the Netherlands, where the Zeeschelde proceeds into the Westerschelde (at kilometer 100), peaks of consecutively nitrate loss and nitrate gain are observed. This seems to correspond to consecutive peaks of dissolved oxygen gain and loss respectively, indicating a zone of increased nitrification. Although only measured up to the border, there seems to be no difference in biological oxygen demand in this zone.
Within the Humber, peaks of nitrate, ammonium and dissolved oxygen are observed near kilometer 90, where the mesohaline zone ends and proceeds to the polyhaline zone (fig. 37). Within this zone also dissolved oxygen oversaturation is frequently observed (also see fig. 44). Chlorophyll extract is not represented here, since the values are only very low within this very turbid estuarine system and hence are not very likely to affect nitrogen dynamics.
Phosphate
The Humber is the most phosphate-exporting estuary (4 ton/yr*km), while most is removed in the Scheldt estuary (-1 ton/yr*km). In winter in both Elbe and Scheldt more phosphate is lost. However, in the Humber more phosphate is gained in winter (fig. 38). However, considering input concentrations it is clear that phosphate losses in winter have more effect in the Scheldt than in the Elbe estuary. Nevertheless, it is the gain of phosphate within the Humber estuary that is most effective (fig. 38).
Phosphorus input
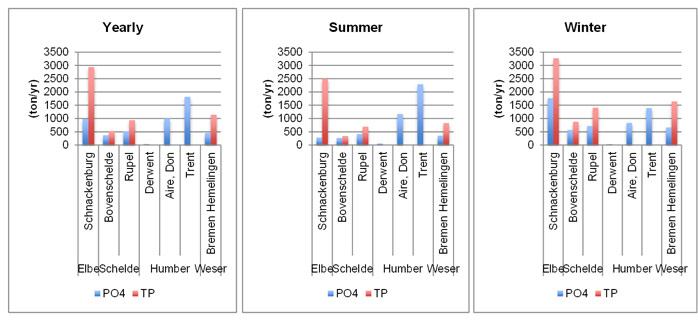
Like for nitrogen, also phosphorus input (fig. 39) is highest within the Elbe estuary (3.0 kton/yr total phosphorus input). In the Elbe there appears also to be a relatively higher input of total phosphorus concentration, and thus organic phosphorus, compared with the other two estuaries (in the Humber total phosphorus is not measured). Next, the highest phosphate input is observed within the Humber estuary (1.8 kton/yr phosphate input), at the mouth of the Trent. Input of phosphate in the Scheldt and Weser estuaries are in the same order of magnitude. Although, total phosphorus input is higher in the Weser. Within the Scheldt, again input is elevated near the mouth of the Rupel. In general, also input of phosphorus is highest in winter. However, differences between summer and winter are smaller than for nitrogen. Difference between winter and summer concentrations for solely phosphate are highest in the Elbe (more than 6 times more input in winter). For total phosphorus, difference is highest in the Bovenschelde (more than 2 times more input in winter).
Estuarine processing
In both the Elbe and Scheldt estuaries, phosphate is subsequently gained and lost along the estuarine gradient (fig. 40). Phosphate dynamics decrease abruptly from the mid-mesohaline zone towards the sea. These patterns do not seem to show any clear correlation, with oxygen dynamics, chlorophyll a concentrations, suspended particulate matter distribution or biological oxygen demand in the Elbe estuary. In the Scheldt estuary, a decrease in chlorophyll a concentrations and more elevate suspended particulate matter concentrations in the upper reaches of the estuary could be related to a phosphate loss, as it can be observed that peaks of phosphate loss are smaller heading towards the sea, together with decreasing chlorophyll a and suspended matter concentrations. Within the Humber estuary, a peak of suspended matter concentration and oxygen gain at kilometer 90 coincides with a peak of phosphate gain. This is the border zone between the mesohaline and polyhaline zone. It could be that phosphorus in the Humber is associated with the very high concentrations of suspended particulate matter, and is being released as it arrives in the high chlorinity zone resulting in this large peak of phosphate gain. Although this does not correspond to what is expected from the bell shaped theory in which phosphate is released in the oligohaline zone (see earlier, ‘1.2.2.2 Sink and source function regulation: Phosphorus’ ).
Dissolved silica
Gain and loss of dissolved silica could only be calculated for the Elbe and Scheldt estuary. The Elbe is exporting dissolved silica (36 ton/yr*km), while the Scheldt removes dissolved silica (-6 ton/yr*km). Considering initial concentrations of dissolved silica, the loss of dissolved silica seems to affect the Scheldt estuary more, than export is affecting the Elbe estuary (fig. 41).
Dissolved silica input
Input of dissolved silica is highest in the Elbe estuary (fig. 42). Input in the Scheldt estuary is slightly higher than in the Humber estuary. In the Scheldt, also for dissolved silica an elevated input can be observed near the Rupel mouth. In the Humber, input is most elevated near the Trent mouth. In the Weser dissolved silica is not measured at the boundary. Like for nitrogen and phosphorus, dissolved silica inputs are higher in winter. Difference between winter and summer concentrations are most pronounced at the Elbe boundary (input is about 7 times higher in winter).
Estuarine processing
In the Humber and Weser too few data measurements were available to calculate gain and loss dynamics for dissolved silica. Here beneath dissolved silica and possible regulating factors are displayed for the Elbe and Scheldt estuaries for 6 yearly averages for a spring, summer and autumn period (fig. 43).
In general chlorophyll a concentrations are highest in the most upstream part of the estuary examined. In the Elbe highest values are reached in spring, while in the Scheldt highest values are attained in summer, indicating a different period of algal bloom in both estuaries. Overall highest values are found in the Scheldt estuary.
In the Elbe a sudden drop in chlorophyll a is observed coinciding with an increase in depth near TIDE km 40, mostly pronounced in spring (not in autumn). However, it is not until summer a loss of dissolved silica can be observed in the freshwater part. In both spring and summer, as observed to be here the period of algal activity, a peak of loss near 90 TIDE km (Glückstadter Nebenelbe) and a peak of gain near 120 TIDE km (Öste mouth) of dissolved silica can be found.
In the Scheldt a maximum in chlorophyll a is observed at TIDE-km 32-35 near the Dender tributary (TIDE-km 39). Although the highest peak of chlorophyll a is reached in summer, in spring a small peak downstream (near TIDE-km 136) can be observed. Furthermore, after decreasing from 35 TIDE-km onwards, a very short chlorophyll a peak is observed near TIDE-km 71. In spring, dissolved silica gain and loss dynamics are very variable along the Scheldt estuarine gradient, while in summer and autumn (the period of most algal activity), a peak of gain the most clear peak can be observed at the mouth of the Rupel (TIDE-km 60). In autumn also a large peak near TIDE-km 120 can be found.
Gain or loss of dissolved silica seems to be mainly regulated by input from tributaries and boundaries, mostly observed during the period of algal activity. Algal bloom in the Elbe occurs in spring, while in summer in the Scheldt.
Oxygen deficiencies
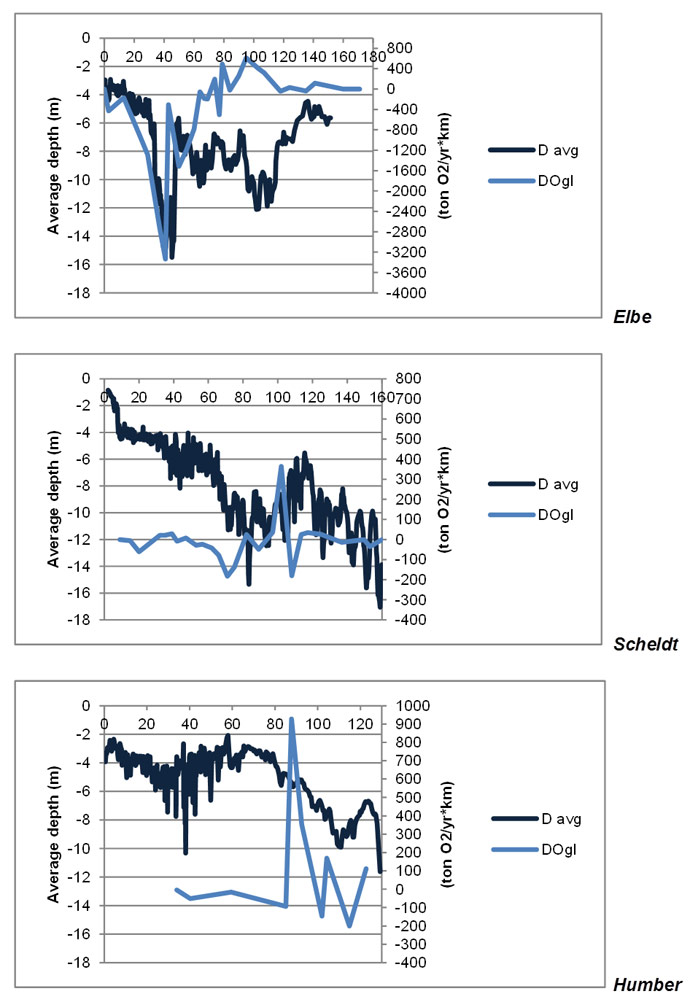
From all estuaries studied, it is mostly the Elbe now re-experiencing oxygen deficit problems within the mid-freshwater zone (within and downstream the port area). This appears to be a consequence of bathymetry (fig. 46). A peak of oxygen loss coincides clearly with the deeper part in the freshwater zone of the Elbe estuary. In the Scheldt and Humber estuaries such a pattern in bathymetry cannot be found. For the Weser, too few data measurements were available to detect a pattern between oxygen and depth. However, for the sampling points that have been measured in the Weser estuary, there seems to be no problem of any oxygen deficits, since it has the highest dissolved oxygen concentrations of all four estuaries examined (see fig. 44 earlier). Previous oxygen deficiencies in the Scheldt appear to have reduced nowadays (fig. 44). As clear from the graph below, this is not related to bathymetry in any way. However, it can be explained by nitrogen dynamics (see ‘3.2.3.4 Different sink and source functions for the Elbe, Scheldt and Humber estuaries’ ), and changes in organic matter and nitrogen input (see further, ‘3.2.4.2 Biological oxygen demand’ ).
Decrease in biological oxygen demand in the Scheldt estuary
The decrease in biological oxygen demand in the Scheldt can be explained by changes in the nitrogen input for the time period studied (fig. 48). With decreasing ammonium input, less is to be nitrified and biological oxygen demand also has decreased. However, in general nitrate load is still increasing in both Bovenschelde and Rupel (except for a decrease in the last year of the six-year period studied).
The absolute error for estimating gross primary production (GPP) from continuous oxygen series decreases for time intervals more than 15 days. Considering longer time intervals might obscure short time fluctuations. Shorter time intervals cause overestimates of GPP (fig. 50, table 6). The signal of GPP in dissolved oxygen series also has to be large enough. Hence, a minimum of primary production is required. Therefore, GPP was estimated (1) for time intervals of 14 days and (2) from March to October, so that primary production is always higher than 15 mmol C/m2 day. For the Humber no results are shown, since no GPP could be detected in the signal of continuous oxygen series. Thus, from this method gross primary production within the Humber estuary in the water column could be considered insignificant. Chlorophyll a is not measured within the Humber. Only chlorophyll extract values are available and also these are very low compared with the chlorophyll a values for the Elbe and Scheldt (see earlier, ‘3.2.4.3 Chlorophyll a concentration’ ).
Table 6 Different estimates of average GPP (mmol C/m2 d) for Elbe, Scheldt and Weser for different time intervals. Between brackets the number of estimates from which the average was calculated is given. At the bottom of the table overall mean, absolute and relative standard deviation are given.
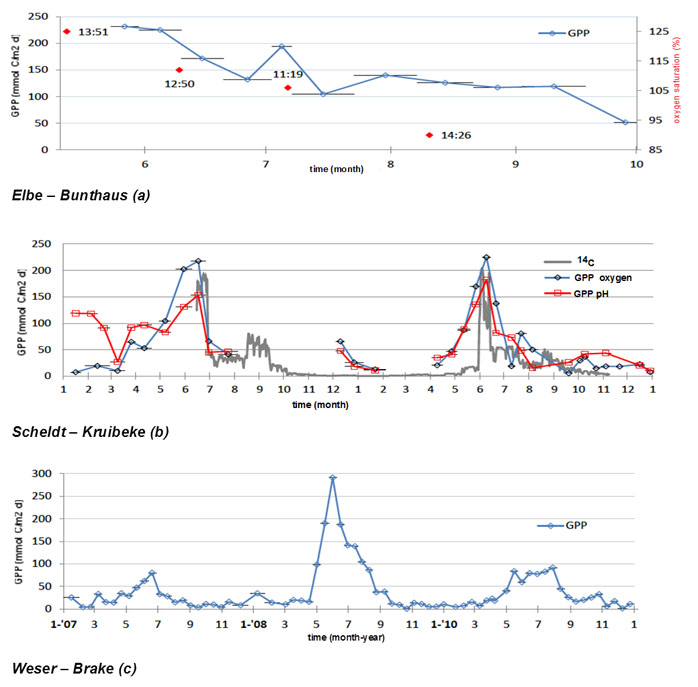
In the Elbe estuary maximum gross primary production can be observed at the end of May (223 mmol C/m2 d). During summer GPP decreases again to values of 51 mmol C/m2 d. Oxygen saturation concentrations seem to follow a similar trend (fig. 51). In the Scheldt, GPP estimates were also made based on continuous pH data. Furthermore, it was compared with primary production estimates from the 14C method to check validity of the GPP estimates from continuous oxygen (and pH) series. Initially, large differences between GPP estimates for pH and O2 could be found in January and February 2009, but from March on discrepancies are limited. A large peak in June 2009 could be found for estimates from both oxygen and pH series (pH: 153 mmol C/m2 d; O2: 218 mmol C/m2 d). Also in June 2010 a large peak of GPP could be detected. Both methods appear to correlate well with the 14C method (Pearson’s correlation for pH and O2 are 0.80 and 0.82 resp., p<0.001). Most differences were to be found in spring and winter 2010, where estimates of GPP from continuous oxygen and pH series were higher than for estimates from the 14C method (fig. 51). Dips in GPP in the Scheldt corresponded with dips in dissolved silica and PAR (not shown here). Effect of stratification during slack tide, giving a maximum gradient of 0.2 mg O2/l, lead to a maximum difference of 2 mmol C/m2 d in GPP estimates.
In the Weser GPP is largest in 2008. A peak of 291 mmol C/m2 d could be found at the end of May. In summer 2007 a smaller peak of 87 mmol C/m2 d could be observed. In 2009 primary production fluctuates from May to August around 80 mmol C/m2 d.
Estimates of yearly averages were not possible, because of data fragmentation and minimum time interval lengths required.
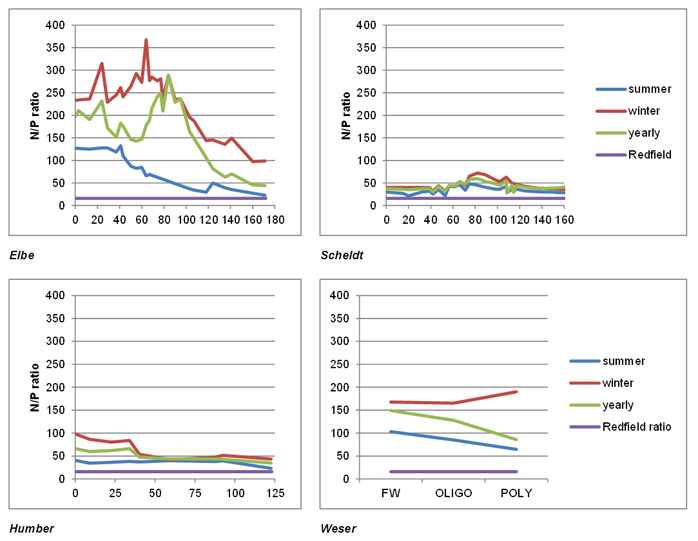
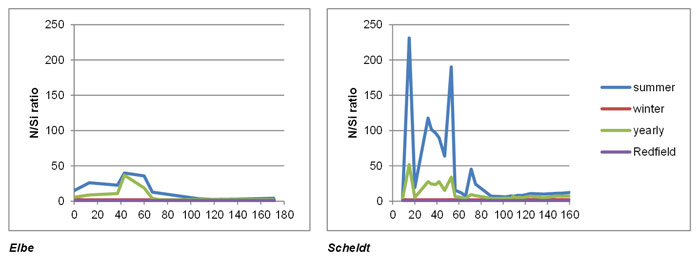
The nitrogen phosphorus ratio is highest within the freshwater zone of the Elbe estuary (181.0 ± 7.80), while lowest in the freshwater zone of the Scheldt estuary (37.5 ± 1.15). In general the nitrogen phosphorus ratio is higher in winter in all estuaries. Within the Elbe a peak can be observed near 20 and 60 TIDE km in winter and near 80 TIDE km in summer within the freshwater zone. In the Scheldt peaks can be observed near 70 and 80 TIDE km in summer and winter respectively. In the Humber, nitrogen phosphorus ratios are high in the freshwater zone and then abruptly decrease towards the sea. The Weser has too few data points to really detect a trend. However, the nitrogen phosphorus ratios are in the same order of magnitude as those in the Elbe estuary. In all estuaries the ratio is always above the Redfield ratio (16:1), implying a relative limitation for phosphorus. This potential limitation is most pronounced within the Elbe estuary within the freshwater zone (fig. 52).
Nitrogen silica ratio
The nitrogen silica ratio is observed for too few data points in Weser and Humber. Therefore, here beneath only ratios for the Elbe and Scheldt are plotted (fig. 53). On average, the nitrogen silica ratio is observed to be highest in the freshwater zone of the Scheldt estuary (21.1 ± 6.50). Also in the Elbe ratios are highest in the freshwater zone (15.8 ± 3.91). In the Elbe a peak is seen near 40 TIDE km (in the port area), in the Scheldt peaks are seen near 15, 30, 50 and 70 TIDE km. In winter ratios approach the Redfield ratio (1:1), while in summer there is a relative limitation of dissolved silica. From the end of the freshwater zone towards the sea, silica limitation abruptly decreases and observed ratios approach the Redfield ratio.
Phosphorus silica ratio
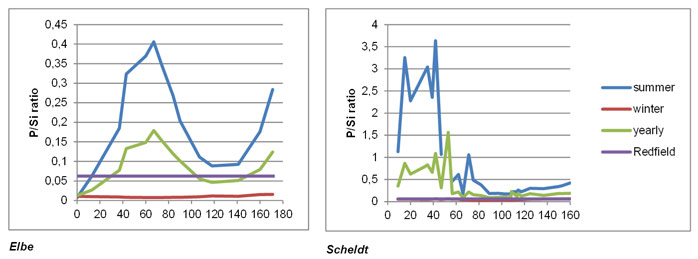
Phosphorus silica ratios are highest in the Scheldt estuary (Attachment 2 ), within the freshwater zone (0.6 ± 0.13, six-yearly average based on a yearly period). Also in the Elbe ratios are highest in the freshwater zone (0.11 ± 0.01). In general in both estuaries, ratios are higher in summer (fig. 54). In the Scheldt ratios abruptly decrease from the freshwater zone towards the sea, while in the Elbe ratios seem to increase again in the polyhaline zone. Relative to the Redfield ratio (1:16), along most of the estuarine gradient there appears to be a limitation for silica in both estuaries, except for the winter season in which there is rather a potential limitation for phosphorus along the whole estuarine gradient. In the Elbe in summer and during the year, also a potential limitation for phosphorus can occur within the upper part of the freshwater zone and within the oligo- and mesohaline zone (fig. 54).
Back to top
How do TIDE estuaries function as a filter for nutrients?
What are the important factors controlling ecosystem functioning?
What is important in establishing a zonation for estuaries?
What parameters should be used to define and evaluate measure targets?
Which measures are suitable to improve the physical characteristics and chemical water quality?
Which variables limit estuarine primary production?
An interestuarine comparison for ecology in TIDE
Table of content
- 1. Introduction
- 1a. Biogeochemical processing for N, P and Si in Northern temperate estuaries
- 1b. Nutrient fluxes
- 1c. Primary production
- 1d. Differences and similarities between Elbe, Scheldt, Humber and Weser
- 2. Material and methods
- 2a. Study area & period
- 2b. Physics
- 2c. Biogeochemistry
- 3. Results
- 3a. Physics 2
- 3b. Biogeochemistry 2
- 4. Discussion
- 4a. Estuarine patterns
- 4b. Different sink and source functions for nutrients
- 4c. Oxygen deficiencies
- 4d. Primary production 2
- 5. Conclusion
- 5a. What are the important factors controlling ecosystem functioning within the TIDE estuaries?
- 5b. How do TIDE estuaries function as a filter for nutrients?
- 5c. How can we avoid oxygen deficiency situations in the TIDE estuaries?
- 5d. Which variables limit primary production in the TIDE estuaries?
- 5e. Lessons learnt from TIDE: towards ecosystem services and measures, recommendations for further estuarine management
- 6. References
Authors:
by Geerts L, Maris T, Meire P
With contributions of Beauchard O, Schöl A, Vandenbruwaene W., Van Damme S, Wolfstein K, Manson S, Saathoff S, Soetaert K, Cox T, Meire A, (February 2013)
by Geerts L, Maris T, Meire P
With contributions of Beauchard O, Schöl A, Vandenbruwaene W., Van Damme S, Wolfstein K, Manson S, Saathoff S, Soetaert K, Cox T, Meire A, (February 2013)
3b. Biogeochemistry
General parameters
In general temperature (Attachment 2 ) is observed to be highest within the Scheldt estuary (13.2 ± 0.2 °C) and lowest within the Humber estuary (10.9 ± 0.3 °C). In winter temperature is lowest within the Elbe (4.62 ± 0.2 °C). When considering whole estuarine seasonal temperature differences, the Elbe shows the largest difference between winter and summer temperature. On a yearly basis, temperature decreases towards the sea in all estuaries.Chlorinity (fig. 13) intrudes up the furthest in the Elbe estuary, next in the Scheldt estuary and least in the Weser estuary. The Elbe estuary has a very extended freshwater zone (0-91 km). The maximum chlorinity (Attachment 2 ) for Elbe, Scheldt and Humber lay more or less in the same range, indicating a similar estuarine gradient is considered for data comparison (17 800 ± 151.4 mg CL/l; 17 929,3 ± 247.9 mg CL/l; 21 319 ± 426.8 mg CL/l; respectively). For the Weser there are mostly three sampling stations during the time period studied in TIDE, of which two are located in the freshwater zone.
Overall the whole estuarine gradient, pH (Attachment 2 ) is observed to be highest within the Elbe estuary (8.0 ± 0.01) and lowest within the Humber estuary (7.78 ± 0.01). Difference between summer and winter is most pronounced within the Elbe estuary (pHsummer – pHwinter = 0.11), next within the Scheldt estuary (0.08). In the Humber there is no difference in pH between summer and winter. In all estuaries pH is high within the freshwater zone, decreases in the oligohaline zone and again increases towards the polyhaline zone.
Suspended particulate matter (Attachment 2 ) is clearly the highest within the Humber estuary (on average 268.1 ± 18.1 mg/l; maximum 2082.0 mg/l). The lowest values can be observed within the Scheldt estuary (65.3 ± 2.0 mg/l). In general suspended matter concentrations appear to be higher in winter than in summer for the Elbe, Scheldt and Weser estuary (SPMwinter - SPMsummer = 75.8; 28.4 & 31.9 mg/l resp.). In the Humber summer concentrations are slightly higher than in winter, showing a reverse pattern. However, the difference between summer and winter is less pronounced than for the other estuaries (SPMwinter - SPMsummer = -24.2 mg/l). In the Elbe suspended matter concentrations seem to increase towards the oligohaline zone and decrease again towards the freshwater zone. In the Humber highest suspended matter concentrations usually can be found along the stretch of the oligo- and mesohaline zone. Also in the Weser highest concentrations are observed within the oligo- and mesohaline zone. Within the Scheldt the highest concentrations are often observed within the freshwater zone, sometimes also within the oligohaline stretch (fig. 14). Estuarine patterns are clearly different.
Based upon suspended matter concentrations, euphotic depth can be estimated and compared with bathymetrical depth. Bathymetrical depth can be considered as mixing depth in well-mixed macro-tidal estuaries. In general euphotic depth is highest in the polyhaline and next, the freshwater zone of all estuaries. Within the Elbe it can be observed that as mixing depth increases, euphotic depth clearly decreases (fig. 15) and although deeper, that towards the polyhaline zone euphotic depth is increasing again. From all four estuaries, euphotic depths are highest in the polyhaline and freshwater zone of the Elbe (1.4 m and 1.2 m resp.). However, self-shading effects of algae are not considered in the formula that is used to deduce euphotic depth (see ‘2 Material and Methods’ ). Within the Scheldt estuary, euphotic depth is lower within the oligohaline zone than in the freshwater zone (even more pronounced in winter). From the oligohaline zone towards the mesohaline zone, euphotic depth abruptly increases again. Within the Humber, euphotic depth rapidly decreases from the upper boundary into the freshwater zone up to polyhaline zone. It is not until the end of the polyhaline zone that euphotic depth is increasing again. Euphotic depths are observed to be lowest in the Humber estuary (0.2 m in the oligohaline zone). Within in the Weser to few data points are monitored to really see a trend in euphotic depth with mixing depth (fig. 15).
Euphotic depth, mixing depth ratios taking a six-yearly average on a yearly, summer and winter basis are in general highest in the freshwater zone. Fig. 16 reveals that ratios are highest in the freshwater zone of the Scheldt estuary (0.49). Ratios are lowest within the oligohaline zone of the Elbe (0.02) and mesohaline zone of the Humber (0.01). Even within the Elbe freshwater zone (FW3) ratios are very low (0.04), because of the very large bathymetrical depth. Differences between winter and summer are relatively limited (fig. 16).
3b. Estuarine patterns
Correlation analyses (Elbe, Scheldt, Humber & Weser)
Correlations larger than r = 0.50 found in all four estuaries (Attachment 3 ), include chlorinity with conductivity, dissolved oxygen with dissolved oxygen saturation and total dissolved inorganic nitrogen with nitrate. The first indicates a pure physical relationship that is created within estuaries due to mixing with seawater. The second, between oxygen parameters is rather obvious. However, the third correlation in all four estuaries observed, between total dissolved inorganic nitrogen and nitrate, indicates that most of total dissolved inorganic nitrogen consists of nitrate and in all estuaries nitrification and mineralization are the most important processes over denitrification and primary production. The correlation is clearly lower in the Scheldt estuary, possibly indicating, that denitrification and/or primary production are more pronounced within this estuary.Correlations found in almost all estuaries, include dissolved oxygen with temperature and suspended matter concentration with total phosphorus. Dissolved oxygen and temperature are correlated by physics, since less oxygen can dissolve with increasing temperature. Absence of this physically regulated correlation larger than 0.50 within the Scheldt estuary might indicate the larger importance of other oxygen influencing processes over the physical ones compared to the other estuaries in TIDE. The correlation between suspended particulate matter and total phosphate in the Elbe, Scheldt and Weser, while there is a lack of correlation between suspended matter and phosphate in these estuaries, show that a large part of suspended particulate matter consists out of organic phosphorus. This correlation presumably also exist within the Humber estuary, as can be seen from the phosphate dynamics (see further); however total phosphorus was not measured within this estuary. Correlation is less pronounced in the Scheldt estuary. Further correlation with organic carbon compounds with suspended matter was also only found within the Elbe and Weser. In the Humber no organic carbon compounds were measured during the six-year period studied.
Furthermore, some characteristic correlations per estuary could be found. In the Scheldt there was a clear negative correlation of dissolved constituents (dissolved organic carbon, nitrate, phosphate, …) with chlorinity. In the Elbe estuary there is a clear correlation between chlorophyll a, biological oxygen demand and phaeopigments, likely indicating that chlorophyll a represents a large part of the organic matter input within the estuary. The Weser and Humber strongest correlations mostly reflect physical ones, such as between temperature and dissolved oxygen.
Multivariate analyses (Elbe, Scheldt & Humber)
(with contribution of Olivier Beauchard)A more extensive and equilibrated examination of estuarine functioning per zone and season in different estuaries was performed using a multivariate analysis technique, principal component analysis. Data is needed for all zones and seasons. Since for the Weser only data was available from 2004 to 2009 for mostly the freshwater and oligohaline zone, the Weser could not be further included in this analysis. Shared data between the Elbe, Scheldt and Humber include the following 13 variables: temperature, chlorinity, pH, suspended particulate matter, dissolved oxygen, dissolved oxygen saturation, nitrate, nitrite, total dissolved inorganic nitrogen, ammonium, phosphate, dissolved silica and chlorophyll a (however, chlorophyll data in the Humber represents chlorophyll extract and not chlorophyll a data; nevertheless it should indicates its importance in this type of analysis). Because of data gaps, only the years 2004 to 2006 could be included in the analysis.
Spatial and temporal differences of physic-chemical processes per estuary
In a first step, three separate principal component analyses per estuary were performed (fig.17). For all three estuaries a clear upstream-downstream gradient from the freshwater to the polyhaline zone can be found. The freshwater is characterized by high nutrient concentrations, decreasing gradually towards the polyhaline zone. The polyhaline zone on the contrary is characterized by high pH values and high dissolved oxygen concentrations (fig. 17; A-C & D-F). Furthermore, also the opposition between winter and summer season is clearly displayed for all three estuaries (fig. 17; G-I). However, the physico-chemical processes defining this seasonality, differ markedly between estuaries. In the Scheldt winter to summer seasonality is defined by increasing temperature and chlorophyll a concentrations, meanwhile in the Elbe winter to summer seasonality is defined by increasing phosphate concentrations and decreasing chlorophyll a concentrations. In the Humber estuary the winter to summer seasonality is mostly defined by an increase in temperature and a decrease in ammonium (fig. 17; A-C & G-I).
Between analyses per estuary reveal that the most significant structuring factor is salinity, next seasonality (fig. 18; p<0.01). For the three years examined, no significant year effect could be found for any of the estuaries.
To further examine how zones differ from each other in physico-chemical processes for the different estuaries, a partial triadic analysis has been performed. Respectively to each zone, a table is defined by the physico-chemical descriptors measured three times (2004-2006) during the four seasons (season-year in lines × descriptor in columns). Next, correlations are made between all estuarine zones. The correlation matrix (table 4) and circle (fig. 19) between estuarine zones exhibits a majority of significant Rv coefficients, indicating that many of them share similar seasonal patterns of processes. Most differences with respect to the other estuarine zones are to be found in the freshwater and oligohaline zones of the Scheldt and Humber estuaries.
The average estuarine pattern that can be found from this analysis is represented in the compromise structure (fig. 20). The first axis reflects the opposition between winter and summer. Summer is characterized by high temperatures and salinities. Winter rather shows high dissolved silica, dissolved oxygen, total dissolved inorganic nitrogen and nitrate concentrations.
In the intrastructure, distinct seasonal (fig. 21) and physico-chemical (fig. 22) patterns for the Scheldt and Humber estuaries become clear. The Humber estuary is marked by high suspended matter concentrations in summer and autumn, and absence of seasonal variations in chlorophyll a and dissolved silica concentrations in the low salinity zones (fig. 21; I-L & fig. 22; I-L). The Scheldt freshwater zone mainly differs from the Elbe by its peak of primary production, occurring rather in autumn than in spring (fig. 21; A-D & fig. 22 A-D). A general remarkable aspect that can be observed between zones within an estuary is the decrease in seasonal amplitude of the physico-chemical processes in the polyhaline zone. Only within the Scheldt estuary, this decrease can be observed to be gradual along the estuarine gradient (fig. 22; A-D).
To further study how seasons differ from each other in physico-chemical processes between zones, a similar (partial triadic) analysis has been performed. However, now for each season, a table is defined by the physico-chemical descriptors measured three times (2004-2006) for the four different spatial units (zone-year lines × descriptors in columns). Again a correlation matrix (table 5) and circle (fig. 23) are created, but this time displaying correlations between seasons for an average estuarine pattern.
All Rv coefficients are significant (table 5), indicating similar patterns for all seasons. Nevertheless, the winter-spring and summer-autumn opposition can be seen from the correlation circle (fig. 23).
Again, from the compromise it is clear that the upstream parts of Scheldt and Humber (freshwater and oligohaline zone resp.) are most distinct from the other estuarine spatial units (fig. 24).
Although Rv coefficients are significant, from the intrastructure it can be observed that estuarine patterns between zones are most alike for all seasons in the Elbe. In the Humber differences in estuarine patterns between zone decrease in winter, while in the Scheldt a distinction between zones persists throughout the seasons (fig. 25). In all estuarine zones and seasons dissolved constituents (nitrogen species, phosphate) decrease and pH and dissolved oxygen concentrations increase with chlorinity increasing. Ammonium concentrations decrease with increase in temperature and chlorophyll a in summer and autumn, mostly in the Scheldt. The Humber differentiates itself from the other estuaries by its low dissolved silica concentrations and absence of chlorophyll dynamics in summer. The Elbe differentiates itself from the other estuaries by its lower nutrient concentrations in general (fig. 25).
3b. Nutrients
(with contributions of Tom Maris, Stefan Van Damme, Karline Soetaert)Nitrogen
Total dissolved inorganic nitrogen (TDIN)Total dissolved inorganic nitrogen concentrations (fig. 26) do not change drastically for the time period studied. However, we can see clearly different spatial patterns for the Elbe, Scheldt and Humber estuaries. The spatial distribution of the Weser could not be considered because total dissolved inorganic nitrogen was measured in only three, occasionally four sampling stations, within the freshwater, oligohaline and sometimes the polyhaline zone. The concentrations however, seem to be in the same order of magnitude then those for the Elbe estuary.
The concentrations of total dissolved inorganic nitrogen (Attachment 2 ) averaged over the six-year period studied, are highest within the Scheldt estuary (4.2 ± 0.09 mg N/l) and lowest within the Elbe estuary (3.0 ± 0.08 mg N/l). The highest concentrations in the Elbe, Scheldt, Humber and Weser are observed in the oligohaline, freshwater, oligohaline and freshwater zone respectively. In the Scheldt a gradual decrease towards the sea can be observed, while in the Elbe and Humber local peaks and valleys are displayed (fig. 26). In all estuaries total dissolved inorganic nitrogen concentrations are highest in winter (Attachment 2 ). The six-yearly average difference between winter and summer concentration for the zone of highest total dissolved nitrogen concentration per estuary is observed to be highest within the Elbe estuary (2.73 mg N/l), next the Weser estuary (2.01 mg N/l) and the Scheldt estuary (1.88 mg N/l) and lowest within the Humber estuary (0.05 mg N/l). However, taking into account the missing data in the Elbe estuary, this summer winter difference is likely to be higher in the freshwater zone than the oligohaline zone.
To understand these different patterns, a closer study of ammonium and nitrate concentrations (see further) is performed, the two species mostly involved within biogeochemical processing for nitrogen. Besides concentrations, also deviations from the expected concentrations due to conservative mixing are considered here. This gives insight into the sink and source function per zone. Unfortunately sink and source functions could not be studied for the Weser estuary, since not enough data were available along the estuarine salinity gradient to apply this method.
Nitrate and ammonium dynamics
In general, along the overall estuarine gradient, highest average nitrate concentrations (Attachment 2 ) are reached in the Scheldt and Humber estuary (3.67 ± 0.07 mg N/l and 3.67 ± 0.10 mg N/l resp.). Lowest average nitrate concentrations can be observed in the Elbe estuary (2.60 ± 0.05 mg N/l). In both Scheldt and Elbe nitrate concentrations appear to decrease towards the sea. In the Humber concentrations seem to reach a maximum along the oligo- to mesohaline stretch (fig. 27). Nitrate concentrations are also highest in winter within the same zones as observed for total dissolved inorganic nitrogen (see earlier). The six-yearly average difference between winter and summer concentration for the zone of highest nitrate concentration per estuary is observed to be highest within the Elbe estuary (2.25 mg N/l), next the Weser estuary (1.92 mg N/l) and the Scheldt estuary (0.87 mg N/l) and lowest within the Humber estuary (0.20 mg N/l). Considering the surfer plots of gain and loss of observed nitrate concentration relative to the expected concentration due to mixing, in Elbe and Scheldt gain and loss seem to alternate along the estuarine gradient, while in the Humber there are clear patches of nitrate gain and loss displayed (fig. 27).
Gain and loss multiplied with freshwater discharge, averaged per zone for the six-year period studied on a yearly basis (fig. 28) shows that most nitrate is gained within the freshwater zone of the Elbe estuary (91 ton N/yr*km) and least nitrate is gained within the freshwater zone of the Scheldt (1 ton N/yr*km). Nitrate loss is highest within the mesohaline zone of the Humber estuary (-95 ton N/yr*km). In general, in summer there is a tendency for nitrate gain, while in winter there is rather nitrate loss. Except for the oligohaline zone of the Humber, and all zones from the oligohaline zone towards the sea in the Scheldt, where there is nitrate gained in both summer and winter. Taking into account the input concentration, as the concentration of the most upstream point per zone, one can have an idea of the filter efficiency per zone, by dividing gain or loss by its input. On a yearly basis, nitrate is most efficiently removed within the mesohaline zone of the Humber estuary (-1.94 %/km). However, nitrate is also mostly produced within the same estuary, within the oligohaline zone (+ 0.90 %/km). Whether it concerns gain or loss, the filter appears to be more competent in summer than in winter, except for the mesohaline zone of the Humber estuary, in which nitrate is more efficiently removed in winter.
Like for nitrate, also highest ammonium concentrations (Attachment 2 ) as observed in general, along the overall estuarine gradient can be found within the Scheldt estuary (0.44 ± 0.03 mg N/l), having their maximum within the freshwater zone (0.82 ± 0.05 mg N/l) and next gradually decreasing towards the sea (fig. 29). The difference between the estuaries is much more strikingly for ammonium than for nitrate. Even though ammonium concentrations have decreased most pronounced within the Scheldt estuary (fig. 29), six-yearly averaged concentrations are about three times higher than within the Elbe, Weser and Humber estuaries (Attachment 2 ). Although, in the Elbe there is quite a lot of data missing in time and space, it seems concentrations are highest within the freshwater zone (0.14 ± 0.01 mg N/l). Noteworthy are the high concentrations observed in 2006 (fig. 29). In the Humber estuary, ammonium concentrations are higher within the oligohaline zone (0.14 ± 0.02 mg N/l). However, study of the surfer plot shows there is a second peak more downstream at the border of the meso- and polyhaline zone. Furthermore, it appears that the first peak of ammonium within the oligohaline zone shifted more downstream to the mesohaline zone from 2006 to 2007 (fig. 29). In the Weser estuary highest ammonium concentrations can be observed within the oligohaline zone (0.13 ± 0.01 mg N/l). However, it has to be noticed only limited data for the Weser was available (n = 21). Again concentrations for ammonium are like for nitrate higher in winter than in summer. The difference between winter and summer for the zone of maximum concentration is highest within the Scheldt estuary (1.05 mg N/l), followed by the Humber (0.16 mg N/l), Elbe (0.13 mg N/l) and Weser estuaries (0.03 mg N/l).
Compared with nitrate mixing plots, ammonium mixing plots seem to be more defined by distinct zones of gain and loss (fig. 29).
Based upon a six-yearly average, gain of ammonium is highest within the oligohaline zone of the Humber estuary (18 ton N/ yr*km), loss is highest within the oligohaline zone of the Scheldt estuary (-13 ton/yr*km) (fig. 30). Within the Scheldt ammonium is lost in both winter and summer season and on a yearly basis along almost the whole estuarine gradient. Loss is most pronounced during winter season. Within the Humber ammonium is lost in winter and gained in summer. On a yearly basis, ammonium is produced within the Humber along the whole estuarine gradient (fig. 30), despite large patches of ammonium loss observed in the freshwater, meso- and polyhaline zone (fig. 29). Within the Elbe ammonium is gained within the freshwater zone, while lost in the other zones (fig. 30). Considering also the input into every zone, ammonium is gained mostly within the Humber estuary within the oligo- and mesohaline zone, while being most efficiently removed within the oligohaline zone of the Scheldt estuary. Either gain or loss is effectively limited in the Elbe estuary, or ammonium gain is immediately balanced by loss (e.g. ammonium from organic matter mineralization is immediately nitrified) (fig. 30).
Phosphate
Phosphate concentrations (Attachment 2 ) are highest within the Scheldt estuary (0.26 ± 0.01 mg P/l), next within the Humber estuary (0.18 ± 0.01 mg P/l). They are about three to four times higher than within the Elbe and Weser estuaries (0.06 ± 0.002 mg P/l and 0.07 ± 0.002 mg P/l resp.). Phosphate concentrations in the Scheldt are highest in the freshwater zone (0.43 ± 0.01 mg P/l), gradually decreasing towards the sea. Within the Humber highest concentrations are observed along the oligo- and mesohaline stretch (0.28 ± 0.01 mg P/l & 0.20 ± 0.01 mg P/l resp.). Within the Elbe estuary, phosphate concentrations are highest in the oligo- and mesohaline zone. However, they do not differ much along the whole estuarine gradient. Within the Weser phosphate concentrations are in the same order of magnitude than within the Elbe and do not differ greatly between zones either (fig. 31). Only slight differences between winter and summer season are observed, except within the Humber estuary in which phosphate concentrations are higher in summer (Attachment 2 ).On a yearly basis, phosphate is gained most within the oligo- and mesohaline zone of the Humber estuary (10 ton/yr*km) and lost most within the oligohaline zone of the Scheldt estuary (-2 ton/yr*km). Usually, losses are higher in winter than in summer for all estuaries, except for the oligohaline zones of the Elbe and Humber estuaries, in which phosphate is gained more during winter than during summer. In general phosphate is lost along the whole estuarine gradient of the Scheldt and gained along most of the estuarine gradient of the Humber (fig. 32). Taking into account input concentrations per zone, phosphate is mainly lost within the upstream parts of the Scheldt estuary and produced within the middle part of the Humber estuary. Dynamics are clearly lower within the Elbe estuary (fig. 32).
Dissolved silica
Dissolved silica concentrations (Attachment 2 ) are highest within the Scheldt estuary (3.43 ± 0.10 mg DSI/l), followed by the Elbe estuary (2.26 ± 0.12 mg DSI/l). Nevertheless, in the Elbe freshwater zone dissolved silica concentrations fall frequently below 0.3 mg DSI/l, while this only occurs once within the freshwater zone of the Scheldt (fig. 33). Furthermore, in both Scheldt and Elbe concentrations also can fall under 0.3 mg DSI/l within the polyhaline zone. Silica limitation in the Elbe occurs in spring, in the Scheldt in summer. Since 2007 in the Scheldt no limitations occurred anymore, at least not if seasonal averages were considered. The low dissolved silica concentrations in the Weser are result of limited sampling within only the polyhaline zone. Also in the Humber sampling appears to be rather limited in time and space (fig. 33). In both Scheldt and Humber the dissolved silica concentration is highest in the freshwater zone, gradually decreasing towards the sea. Concentrations are higher in winter than summer (Attachment 2) . Difference between average winter and summer dissolved silica concentration within the freshwater zone is slightly higher in the Elbe than in the Scheldt estuary (Scheldt: 5.29 mg DSI/l; Elbe: 4.55 mg DSI/l).The method to calculate gain and loss could only be applied upon the Scheldt and Elbe estuary. In both estuaries clear patches of gain and loss can be distinguished (fig. 33).
In the Elbe dissolved silica is gained within the mid part of the estuary. In the Scheldt dynamics are limited and rather a small loss of dissolved silica can be observed in the mid-estuarine part. Taking input concentration per zone into account, only within the oligohaline part of the Elbe estuary a clear increase of dissolved silica can be seen (8.27 %/km). Mostly there is not that much difference between gain and loss in summer and winter (fig. 34). However, when looking at the mixing plots, it can be noted that dissolved silica is gained in winter and lost in summer (fig. 34).
Different sink and source functions for the Elbe, Scheldt and Humber estuaries
Total dissolved inorganic nitrogenAveraging gain and loss along the whole estuarine length for Elbe, Scheldt and Humber shows that the Elbe is exporting the most amount of inorganic nitrogen (76 ton/yr*km), while most is removed within the Scheldt estuary (-3 ton/yr*km). In the Humber nitrogen is also exported on a yearly basis (18 ton/yr*km). Nitrogen loss appears to be high in winter, while gain is rather high in summer (fig. 35). Taking the starting concentration into account, total dissolved inorganic nitrogen gain has more effect upon the Elbe and Humber estuaries, than removal has upon the Scheldt estuary (fig. 35).
Nitrogen input
Nitrogen import (fig. 36) in the Elbe estuary is obviously the highest compared with the other estuaries (78 kton/yr, nitrate ammonium and organic nitrogen combined). Also much organic nitrogen is mainly imported in the Elbe. Next, much nitrogen is imported in the Weser estuary (47 kton). Input seems to be lowest within the Scheldt estuary. At the Rupel, nitrogen import in the Scheldt is clearly elevated. Import is highest in winter. Difference between winter and summer import is highest in the Weser and within the Scheldt near the Rupel (3.7 and 3.3 times more input in winter, respectively). Difference is lowest in the Humber estuary (only 10 % more input in winter).
Estuarine processing
Ammonium and nitrate are successively gained in the freshwater zone of the Elbe estuary. As biological oxygen demand decreases towards the sea, also gain and loss dynamics for nitrogen seem to decrease. As biological oxygen demand decreases, probably more organic matter is mineralized to ammonium, which is further nitrified to nitrate, explaining the successive gain of ammonium and nitrate. Chlorophyll a concentrations measured, are highest in the freshwater zone, but seem not to be very clear correlated with nitrogen dynamics. It appears biological oxygen demand as indicator for organic matter and ammonium input is the main indicator for nitrogen dynamics. A peak of nitrate gain can be observed near the mouth of the Lühe, while a peak of nitrate loss can be observed near Pagensander Neben Elbe shallow water zone (fig. 37).
In the Scheldt, also chlorophyll a concentrations are very high in the freshwater. However, again there is not a very clear correlation with nitrogen dynamics. In general they are higher than within the Elbe estuary. Most nitrogen gain and loss occurs near the mouth of the Rupel. A clear peak of ammonium gain coincides with a peak of nitrate loss. Near the Rupel also a peak of oxygen loss and a peak of biological demand is observed. It would be expected that ammonium gained from organic matter mineralization is further nitrified to nitrate, giving a peak of nitrate gain. However, a peak of nitrate loss is observed indicating nitrate removal. Together with the low oxygen concentrations observed near the Rupel (see fig. 44, further), it is likely a zone of coupled nitrification-denitrification can be found in the pelagic here. Oxygen and biological oxygen demand again show to be the main indicators for nitrogen dynamics (fig. 37). At the border between Belgium and the Netherlands, where the Zeeschelde proceeds into the Westerschelde (at kilometer 100), peaks of consecutively nitrate loss and nitrate gain are observed. This seems to correspond to consecutive peaks of dissolved oxygen gain and loss respectively, indicating a zone of increased nitrification. Although only measured up to the border, there seems to be no difference in biological oxygen demand in this zone.
Within the Humber, peaks of nitrate, ammonium and dissolved oxygen are observed near kilometer 90, where the mesohaline zone ends and proceeds to the polyhaline zone (fig. 37). Within this zone also dissolved oxygen oversaturation is frequently observed (also see fig. 44). Chlorophyll extract is not represented here, since the values are only very low within this very turbid estuarine system and hence are not very likely to affect nitrogen dynamics.
Phosphate
The Humber is the most phosphate-exporting estuary (4 ton/yr*km), while most is removed in the Scheldt estuary (-1 ton/yr*km). In winter in both Elbe and Scheldt more phosphate is lost. However, in the Humber more phosphate is gained in winter (fig. 38). However, considering input concentrations it is clear that phosphate losses in winter have more effect in the Scheldt than in the Elbe estuary. Nevertheless, it is the gain of phosphate within the Humber estuary that is most effective (fig. 38).
Phosphorus input
Like for nitrogen, also phosphorus input (fig. 39) is highest within the Elbe estuary (3.0 kton/yr total phosphorus input). In the Elbe there appears also to be a relatively higher input of total phosphorus concentration, and thus organic phosphorus, compared with the other two estuaries (in the Humber total phosphorus is not measured). Next, the highest phosphate input is observed within the Humber estuary (1.8 kton/yr phosphate input), at the mouth of the Trent. Input of phosphate in the Scheldt and Weser estuaries are in the same order of magnitude. Although, total phosphorus input is higher in the Weser. Within the Scheldt, again input is elevated near the mouth of the Rupel. In general, also input of phosphorus is highest in winter. However, differences between summer and winter are smaller than for nitrogen. Difference between winter and summer concentrations for solely phosphate are highest in the Elbe (more than 6 times more input in winter). For total phosphorus, difference is highest in the Bovenschelde (more than 2 times more input in winter).
Estuarine processing
In both the Elbe and Scheldt estuaries, phosphate is subsequently gained and lost along the estuarine gradient (fig. 40). Phosphate dynamics decrease abruptly from the mid-mesohaline zone towards the sea. These patterns do not seem to show any clear correlation, with oxygen dynamics, chlorophyll a concentrations, suspended particulate matter distribution or biological oxygen demand in the Elbe estuary. In the Scheldt estuary, a decrease in chlorophyll a concentrations and more elevate suspended particulate matter concentrations in the upper reaches of the estuary could be related to a phosphate loss, as it can be observed that peaks of phosphate loss are smaller heading towards the sea, together with decreasing chlorophyll a and suspended matter concentrations. Within the Humber estuary, a peak of suspended matter concentration and oxygen gain at kilometer 90 coincides with a peak of phosphate gain. This is the border zone between the mesohaline and polyhaline zone. It could be that phosphorus in the Humber is associated with the very high concentrations of suspended particulate matter, and is being released as it arrives in the high chlorinity zone resulting in this large peak of phosphate gain. Although this does not correspond to what is expected from the bell shaped theory in which phosphate is released in the oligohaline zone (see earlier, ‘1.2.2.2 Sink and source function regulation: Phosphorus’ ).
Dissolved silica
Gain and loss of dissolved silica could only be calculated for the Elbe and Scheldt estuary. The Elbe is exporting dissolved silica (36 ton/yr*km), while the Scheldt removes dissolved silica (-6 ton/yr*km). Considering initial concentrations of dissolved silica, the loss of dissolved silica seems to affect the Scheldt estuary more, than export is affecting the Elbe estuary (fig. 41).
Dissolved silica input
Input of dissolved silica is highest in the Elbe estuary (fig. 42). Input in the Scheldt estuary is slightly higher than in the Humber estuary. In the Scheldt, also for dissolved silica an elevated input can be observed near the Rupel mouth. In the Humber, input is most elevated near the Trent mouth. In the Weser dissolved silica is not measured at the boundary. Like for nitrogen and phosphorus, dissolved silica inputs are higher in winter. Difference between winter and summer concentrations are most pronounced at the Elbe boundary (input is about 7 times higher in winter).
Estuarine processing
In the Humber and Weser too few data measurements were available to calculate gain and loss dynamics for dissolved silica. Here beneath dissolved silica and possible regulating factors are displayed for the Elbe and Scheldt estuaries for 6 yearly averages for a spring, summer and autumn period (fig. 43).
In general chlorophyll a concentrations are highest in the most upstream part of the estuary examined. In the Elbe highest values are reached in spring, while in the Scheldt highest values are attained in summer, indicating a different period of algal bloom in both estuaries. Overall highest values are found in the Scheldt estuary.
In the Elbe a sudden drop in chlorophyll a is observed coinciding with an increase in depth near TIDE km 40, mostly pronounced in spring (not in autumn). However, it is not until summer a loss of dissolved silica can be observed in the freshwater part. In both spring and summer, as observed to be here the period of algal activity, a peak of loss near 90 TIDE km (Glückstadter Nebenelbe) and a peak of gain near 120 TIDE km (Öste mouth) of dissolved silica can be found.
In the Scheldt a maximum in chlorophyll a is observed at TIDE-km 32-35 near the Dender tributary (TIDE-km 39). Although the highest peak of chlorophyll a is reached in summer, in spring a small peak downstream (near TIDE-km 136) can be observed. Furthermore, after decreasing from 35 TIDE-km onwards, a very short chlorophyll a peak is observed near TIDE-km 71. In spring, dissolved silica gain and loss dynamics are very variable along the Scheldt estuarine gradient, while in summer and autumn (the period of most algal activity), a peak of gain the most clear peak can be observed at the mouth of the Rupel (TIDE-km 60). In autumn also a large peak near TIDE-km 120 can be found.
Gain or loss of dissolved silica seems to be mainly regulated by input from tributaries and boundaries, mostly observed during the period of algal activity. Algal bloom in the Elbe occurs in spring, while in summer in the Scheldt.
3b. Oxygen and primary production
Dissolved oxygen concentration and saturation
Highest dissolved oxygen concentrations (Attachment 2 ) can be found within the Weser estuary (9.5 ± 0.23 mg O2/l). For the Weser, however, only observations within the freshwater and oligohaline zone were made (fig. 44). Next, the Humber estuary shows the highest oxygen concentrations within the freshwater zone (10.0 ± 0.21 mg O2/l) and the mesohaline zone (9.4 ± 0.19 mg O2/l), followed by the Elbe and the Scheldt estuaries (9.4 ± 0.10 mg O2/l and 6.9 ± 0.10 mg O2/l resp., on average along the whole estuarine gradient for the six-year period studied). Mainly in the Scheldt estuary dissolved oxygen concentrations drop below 5 mg O2/l in the freshwater and oligohaline zone. However, the situation has clearly improved since 2008. In the Elbe estuary dissolved oxygen concentrations drop again below 5 mg O2/l since the summer of 2007 within the freshwater zone after almost two years of well-oxygenated waters (fig. 43). In the Humber concentrations never drop as low as in the Scheldt and Elbe estuaries. However, in summer also within the Humber estuary, oxygen concentrations drop, here along the oligohaline and mesohaline stretch (fig. 44). In general concentrations are always lowest in summer and highest in winter in all estuaries (fig. 44). Considering dissolved oxygen saturation concentrations higher than 100%, oversaturation in the Elbe can be mainly observed within the freshwater zone upstream of the port, where water depth is lower compared to other areas, and in the polyhaline zone. In the Scheldt oversaturation is mostly observed in the polyhaline zone, however recently also observed more upstream. Within the Humber oversaturation are more dispersed along the estuarine gradient. Nevertheless, oversaturation is also consequently observed within the polyhaline zone within this estuary (fig. 44).Oxygen, gain and loss
The same calculation for gain and loss as made for dissolved constituents was made for oxygen concentrations, since it is also ‘dissolved’. Averaging per zone (fig. 45) shows that most dissolved oxygen is gained within the mesohaline zone of the Humber estuary (327 ton/yr*km), and most is lost within the freshwater zone of the Elbe, specifically in the port area (- 600 ton/yr*km). Taking into account the starting concentration per zone, the highest oxygenation is still reached in the mesohaline zone of the Humber estuary (3.4 %/km). However, the greatest oxygen loss considering the starting concentration can now be observed within the oligohaline zone of the Scheldt estuary (- 2.2 %/km).Oxygen deficiencies
From all estuaries studied, it is mostly the Elbe now re-experiencing oxygen deficit problems within the mid-freshwater zone (within and downstream the port area). This appears to be a consequence of bathymetry (fig. 46). A peak of oxygen loss coincides clearly with the deeper part in the freshwater zone of the Elbe estuary. In the Scheldt and Humber estuaries such a pattern in bathymetry cannot be found. For the Weser, too few data measurements were available to detect a pattern between oxygen and depth. However, for the sampling points that have been measured in the Weser estuary, there seems to be no problem of any oxygen deficits, since it has the highest dissolved oxygen concentrations of all four estuaries examined (see fig. 44 earlier). Previous oxygen deficiencies in the Scheldt appear to have reduced nowadays (fig. 44). As clear from the graph below, this is not related to bathymetry in any way. However, it can be explained by nitrogen dynamics (see ‘3.2.3.4 Different sink and source functions for the Elbe, Scheldt and Humber estuaries’ ), and changes in organic matter and nitrogen input (see further, ‘3.2.4.2 Biological oxygen demand’ ).
Biological oxygen demand
On average biological oxygen demand (Attachment 2 ) is clearly much higher within the Scheldt estuary (Scheldt: 6.8 ± 0.16 mg O2/l; Elbe: 2.47 ± 0.07 mg O2/l). The missing polyhaline zone within the Scheldt alone could not explain this large difference between these two estuaries. Although, within the Scheldt the biological oxygen demand has decreased much more during the last 6 years, as can be deduced from the extending contour of 5 mg O2/l. In both estuaries, concentrations are highest in the freshwater zone. Biological oxygen demand is highest in winter and spring, while usually lower in summer. In summer the pattern is different from winter. In winter biological oxygen demand is gradually decreasing towards the sea. In summer, after a decrease towards the oligohaline zone, a (slight) increase can again be observed towards the sea (fig. 47).Decrease in biological oxygen demand in the Scheldt estuary
The decrease in biological oxygen demand in the Scheldt can be explained by changes in the nitrogen input for the time period studied (fig. 48). With decreasing ammonium input, less is to be nitrified and biological oxygen demand also has decreased. However, in general nitrate load is still increasing in both Bovenschelde and Rupel (except for a decrease in the last year of the six-year period studied).
Chlorophyll a concentration
Mean chlorophyll a concentrations (Attachment 2 ) are highest within the Scheldt estuary (52.1 ± 3.09 µg/l), next within the Elbe estuary (38.1 ± 4.86 µg/l). In the Humber chlorophyll extract values are very low. In both Scheldt and Elbe, concentrations are highest in the freshwater zone. However, focusing upon the freshwater zone in the Scheldt they are about almost two times higher than in the Elbe estuary (Elbe: 56.0 ± 7.05 µg/l; Scheldt: 101.1 ± 6.64 µg/l), even when you consider the fact that the Elbe freshwater zone is much more extended (max. in the Elbe: 210 µg/l; Scheldt: 468 µg/l). In the Humber chlorophyll extract values are highest along the oligo- and mesohaline stretch. In general, in summer and spring concentrations are higher than in winter (fig. 49). Differences in concentrations can be explained by differences in dissolved silica limitation, residence time and mainly euphotic depth (see also ‘3.2.1 General parameters’ ).Gross primary production
(with contributions of Alexander Meire & Tom Cox)The absolute error for estimating gross primary production (GPP) from continuous oxygen series decreases for time intervals more than 15 days. Considering longer time intervals might obscure short time fluctuations. Shorter time intervals cause overestimates of GPP (fig. 50, table 6). The signal of GPP in dissolved oxygen series also has to be large enough. Hence, a minimum of primary production is required. Therefore, GPP was estimated (1) for time intervals of 14 days and (2) from March to October, so that primary production is always higher than 15 mmol C/m2 day. For the Humber no results are shown, since no GPP could be detected in the signal of continuous oxygen series. Thus, from this method gross primary production within the Humber estuary in the water column could be considered insignificant. Chlorophyll a is not measured within the Humber. Only chlorophyll extract values are available and also these are very low compared with the chlorophyll a values for the Elbe and Scheldt (see earlier, ‘3.2.4.3 Chlorophyll a concentration’ ).
Table 6 Different estimates of average GPP (mmol C/m2 d) for Elbe, Scheldt and Weser for different time intervals. Between brackets the number of estimates from which the average was calculated is given. At the bottom of the table overall mean, absolute and relative standard deviation are given.
| Estuary | Elbe | Scheldt | Weser | ||||||||||||
| Year | 2009 | 2011 | 2007 | 2008 | 2009 | ||||||||||
| Time interval | Month | 5 | 6 | 7 | 8 | 9 | 7-8 | 9-11 | 1-12 | 12-6 | 6-8 | 7-1 | 1-2 | 3 | 4-12 |
| 30 days | 123 (1) | 45 (2) | 18 (3) | 23 (12) | 56 (6) | 96 (3) | 9 (4) | 40 (8) | |||||||
| 20 days | 189 (1) | 47 (3) | 17 (4) | 30 (18) | 62 (8) | 89 (4) | 9 (6) | 6 (2) | 41 (13) | ||||||
| 15 days | 207 (1) | 122 (2) | 126 (1) | 119 (1) | 42 (4) | 18 (5) | 24 (24) | 70 (11) | 116 (6) | 12 (9) | 9 (3) | 13 (2) | 42 (17) | ||
| 10 days | 207 (2) | 198 (2) | 114 (3) | 44 (6) | 22 (8) | 37 (35) | 70 (17) | 100 (8) | 20 (13) | 16 (5) | 15 (3) | 46 (25) | |||
| 7 days | 199 (3) | 198 (3) | 124 (4) | 120 (2) | 113 (2) | 47 (9) | 25 (11) | 48 (51) | 77 (24) | 123 (12) | 23 (18) | 29 (7) | 18 (4) | 52 (36) | |
| 5 days | 214 (4) | 182 (4) | 132 (6) | 120 (3) | 123 (3) | 48 (13) | 23 (15) | 54 (71) | 81 (33) | 110 (17) | 40 (26) | 20 (9) | 24 (5) | 66 (50) | |
| 3 days | 223 (7) | 198 (7) | 142 (10) | 143 (5) | 121 (5) | 56 (21) | 27 (25) | ||||||||
| mean | 210.1 | 193.2 | 126,2 | 127.3 | 118.9 | 47.2 | 21.4 | 35.8 | 69.2 | 105.6 | 15.8 | 17.4 | 47.5 | ||
| sd | 9.3 | 7.3 | 9.5 | 10.5 | 4.5 | 4.3 | 4.0 | 12.9 | 9.1 | 12.8 | 9.1 | 4.8 | 9.7 | ||
| sd (%) | 4.4 | 3.8 | 7.5 | 8.3 | 3.8 | 9.2 | 18.9 | 36.0 | 13.2 | 12.2 | 57.4 | 27.4 | 20.5 | ||
In the Elbe estuary maximum gross primary production can be observed at the end of May (223 mmol C/m2 d). During summer GPP decreases again to values of 51 mmol C/m2 d. Oxygen saturation concentrations seem to follow a similar trend (fig. 51). In the Scheldt, GPP estimates were also made based on continuous pH data. Furthermore, it was compared with primary production estimates from the 14C method to check validity of the GPP estimates from continuous oxygen (and pH) series. Initially, large differences between GPP estimates for pH and O2 could be found in January and February 2009, but from March on discrepancies are limited. A large peak in June 2009 could be found for estimates from both oxygen and pH series (pH: 153 mmol C/m2 d; O2: 218 mmol C/m2 d). Also in June 2010 a large peak of GPP could be detected. Both methods appear to correlate well with the 14C method (Pearson’s correlation for pH and O2 are 0.80 and 0.82 resp., p<0.001). Most differences were to be found in spring and winter 2010, where estimates of GPP from continuous oxygen and pH series were higher than for estimates from the 14C method (fig. 51). Dips in GPP in the Scheldt corresponded with dips in dissolved silica and PAR (not shown here). Effect of stratification during slack tide, giving a maximum gradient of 0.2 mg O2/l, lead to a maximum difference of 2 mmol C/m2 d in GPP estimates.
In the Weser GPP is largest in 2008. A peak of 291 mmol C/m2 d could be found at the end of May. In summer 2007 a smaller peak of 87 mmol C/m2 d could be observed. In 2009 primary production fluctuates from May to August around 80 mmol C/m2 d.
Estimates of yearly averages were not possible, because of data fragmentation and minimum time interval lengths required.
Nutrient ratios
Nitrogen phosphorus ratioThe nitrogen phosphorus ratio is highest within the freshwater zone of the Elbe estuary (181.0 ± 7.80), while lowest in the freshwater zone of the Scheldt estuary (37.5 ± 1.15). In general the nitrogen phosphorus ratio is higher in winter in all estuaries. Within the Elbe a peak can be observed near 20 and 60 TIDE km in winter and near 80 TIDE km in summer within the freshwater zone. In the Scheldt peaks can be observed near 70 and 80 TIDE km in summer and winter respectively. In the Humber, nitrogen phosphorus ratios are high in the freshwater zone and then abruptly decrease towards the sea. The Weser has too few data points to really detect a trend. However, the nitrogen phosphorus ratios are in the same order of magnitude as those in the Elbe estuary. In all estuaries the ratio is always above the Redfield ratio (16:1), implying a relative limitation for phosphorus. This potential limitation is most pronounced within the Elbe estuary within the freshwater zone (fig. 52).
Nitrogen silica ratio
The nitrogen silica ratio is observed for too few data points in Weser and Humber. Therefore, here beneath only ratios for the Elbe and Scheldt are plotted (fig. 53). On average, the nitrogen silica ratio is observed to be highest in the freshwater zone of the Scheldt estuary (21.1 ± 6.50). Also in the Elbe ratios are highest in the freshwater zone (15.8 ± 3.91). In the Elbe a peak is seen near 40 TIDE km (in the port area), in the Scheldt peaks are seen near 15, 30, 50 and 70 TIDE km. In winter ratios approach the Redfield ratio (1:1), while in summer there is a relative limitation of dissolved silica. From the end of the freshwater zone towards the sea, silica limitation abruptly decreases and observed ratios approach the Redfield ratio.
Phosphorus silica ratio
Phosphorus silica ratios are highest in the Scheldt estuary (Attachment 2 ), within the freshwater zone (0.6 ± 0.13, six-yearly average based on a yearly period). Also in the Elbe ratios are highest in the freshwater zone (0.11 ± 0.01). In general in both estuaries, ratios are higher in summer (fig. 54). In the Scheldt ratios abruptly decrease from the freshwater zone towards the sea, while in the Elbe ratios seem to increase again in the polyhaline zone. Relative to the Redfield ratio (1:16), along most of the estuarine gradient there appears to be a limitation for silica in both estuaries, except for the winter season in which there is rather a potential limitation for phosphorus along the whole estuarine gradient. In the Elbe in summer and during the year, also a potential limitation for phosphorus can occur within the upper part of the freshwater zone and within the oligo- and mesohaline zone (fig. 54).
Important to know
Reports / Measures / Tools
| Report: | Zonation of the TIDE estuaries (Functioning) |
|---|---|
| Report: | Interestuarine comparison: Hydro-geomorphology (Functioning) |
Management issues
How can we avoid oxygen deficiency situations?How do TIDE estuaries function as a filter for nutrients?
What are the important factors controlling ecosystem functioning?
What is important in establishing a zonation for estuaries?
What parameters should be used to define and evaluate measure targets?
Which measures are suitable to improve the physical characteristics and chemical water quality?
Which variables limit estuarine primary production?

