
Disclaimer:
The authors are solely responsible for the content of this report. Material included herein does not represent the opinion of the European Community, and the European Community is not responsible for any use that might be made of it.
Back to overview measures
(1) Morphological analysis
Morphological evolution relocation area (criterium 1)
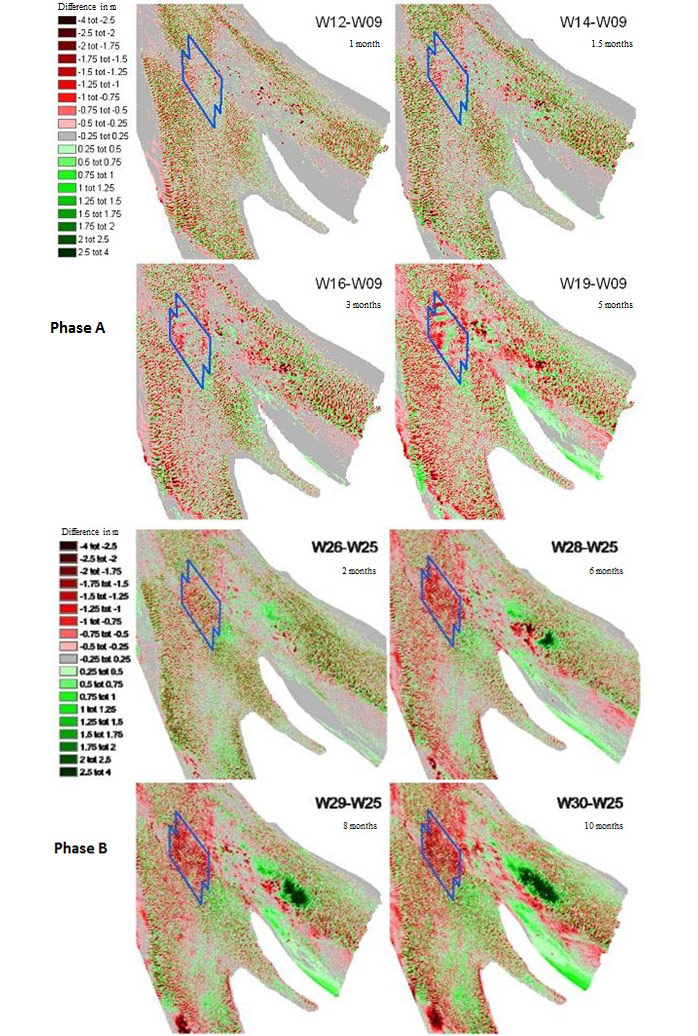
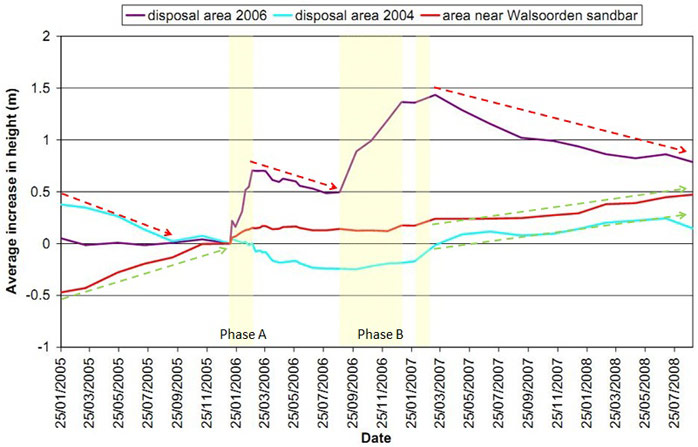
The stability of the relocation test does fulfil the criteria: less than 20% of the total relocated quantity had left the relocation site two weeks after completion of the relocation test. Two weeks after the end of relocation phase A, there is evidence of a limited material decrease (-0.5%). Two weeks after relocation phase B no measurements were conducted but around 2 months after the relocation test, around 15% of the material had disappeared. The transportation of material out of the polygon is oriented towards the sandbar (Figure 5 & Figure 6) which was also the purpose of the relocation at a deeper and more dynamic area further from the sandbar. The larger depth was necessary for the trailing suction hoppers dredger and the relocation area was therefore also located further from the sandbar. This area is also characterized by a higher dynamism, both hydrodynamically (currents) as morphodynamically (sediment transports).
This trend becomes clearer from the long-term results. For phase A of the relocation test, 6 months after the execution of the test ca. 30% of the sediment is transported out of the polygon. For phase B ca. 35% of the relocated material is transported out of the control polygon after 10 months. At the end of 2007 only 50% (or circa 700,000 m³) of the relocation is still in the control polygon. Further analysis in 2008 even showed that in September 2008 (1.5 years after completion of the relocation test) 60% of the relocated material had disappeared [1]. Nevertheless this is a positive result since the material seems to have settled mainly between the relocation area and the sandbar (at the relocation area of 2004 and the area near the Walsoorden sandbar) (Figure 5 & Figure 6).
Criterium 2: Morphological trend at “Schaar van Waarde” and “Schaar van Valkenisse”
Transverse sections were selected at the Schaar van Waarde and Schaar van Valkenisse to control a potential effect of the relocation test: max. 15% of the transverse profiles may have been occupied by sand 2 weeks after the completion of the relocation test. The results show a positive trend: Two weeks after the end of relocation phase A, there was a limited decrease of the transverse profile for the 2 selected transverse sections (-2.8% and -1.1% respectively). Even two months after relocation phase B this criteria was met: the transverse profile decreased with 7.1% at Waarde and 5.2% at Valkenisse compared to the beginning of phase B. From then, the sedimentation at the Schaar van Valkenisse was stable: 6.1% after one year and 5.1% after 1.5 years since the beginning of phase B. Sedimentation at the Schaar van Waarde was however more intense: 5% after one year and 14.3% after 1.5 years since the beginning of phase B. This is, however, attributable to the targeted relocations that took place during the same period in the Schaar van Waarde.
(2) Ecological analysis
The ecological monitoring did not reveal any significant negative impact, neither in the intertidal areas, nor in the subtidal areas. None of the results from this monitoring indicated that the in situ relocation test was responsible for a significant change in ongoing trends. The result of this relocation test could however not be extrapolated to other areas because the effects could differ depending on local characteristics. For every relocation measure and for every area new location monitoring is needed (van der Wal 2010)!
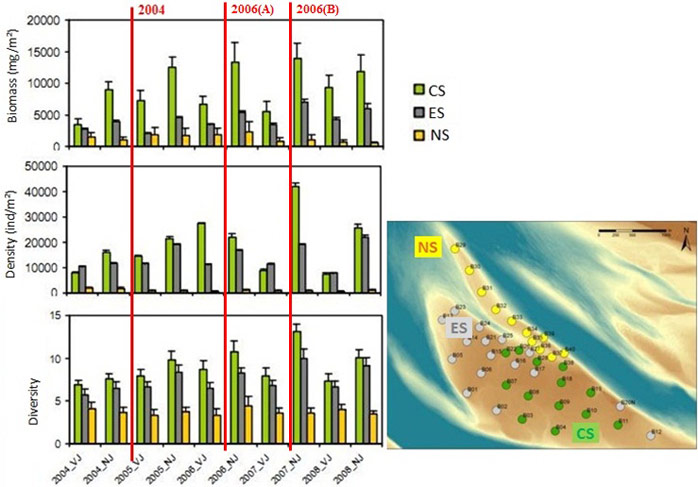
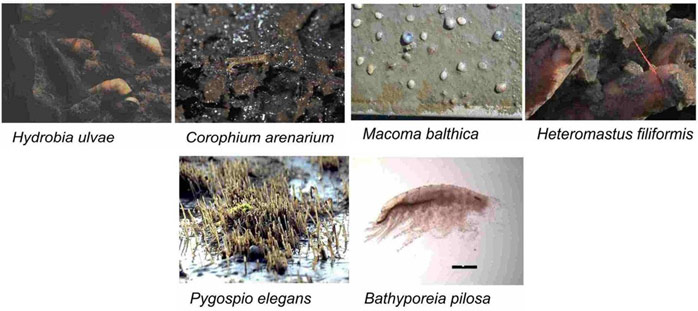
In the intertidal area, no negative effects were detected due to the relocation test. All criteria were fulfilled and changes (mainly at the central part of the sandbank) were in line with the long term trends (elevation, sedimentation, marsh formation, and composition macrobenthos (Figure 7)). The trends in macrobenthos composition are however not similar for every species and based on the analysis of shifts in species diversity, the sandbar tends to shift towards a lower dynamic environment (Vos et al. 2009). This was also the case in the control zone and cannot, therefore, be attributed to the relocation test. The dominant intertidal macrobenthos species on the Walsoorden sandbank are presented in Figure 8.
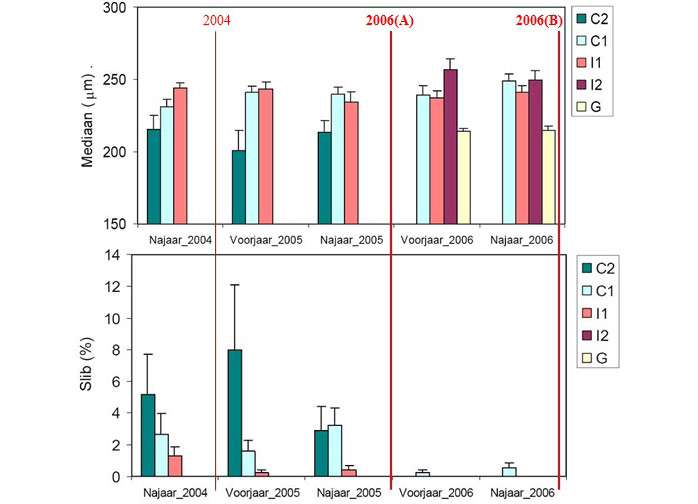
In the subtidal area, the relocation test has resulted in a significant local change in the sediment composition: the mud content decreased at C1 and I1 (Figure 9). At the impact area I1 (corresponds to relocation area 2004) this trend was already visible during the monitoring of the 2004 monitoring program. From the new data, the development to more sandy sediment seems to continue. This was not really a surprise since the dredged material was poorer in mud content compared to the sediment that was present at the relocation area, and in addition dredging and relocation may lead to suspension of mud from which the relocated material could become even more poor in mud content. A comparable analysis for the new relocation area (I2) was not possible because sediment was not sampled before the relocation test and only two samples were taken in total.
At location I1, a significant decrease in macrobenthos biomass was measured (Figure 10). However, this was also measured at the control area C1 (as well as a decrease in diversity and density). The significant change was hence due to a general evolution and not due to the relocation test. This is surprising since the changes in sediment composition. This may be explained by the fact that the benthos community was already poor before the relocation test (Forster et al. 2006). The dominant subtidal macrobenthos species at Walsoorden are presented in Figure 11.
Back to top
Walsoorden pilot part B (2006): relocation of dredged sediment to a shallow water area at the edge of the Walsoorden sandbar
Table of content
- 1. Description of measure
- 1a. Measure description
- 1b. Monitoring
- 1c. Monitoring results
- 2. Execution of main effectiveness criteria
- 2a. Effectiveness according to development targets of measure
- 2b. Impact on ecosystem services
- 2c. Degree of synergistic effects and conflicts according to uses
- 3. Additional evaluation criteria in view of EU environmental law
- 3a. Degree of synergistic effects and conflicts according to WFD aims
- 3b. Degree of synergistic effects and conflicts according to Natura 2000 aims
- 4. Crux of the matter
- 5. References
Additional information
for this measure:
No further information available.
for this measure:
No further information available.
Monitoring results
Table 1. Overview of morphological and ecological criteria of the relocation test and the observed effects (Vos et al. 2009)| Predefined criteria | Observed effects | |
| 1. Morphological criteria | ||
| 1.1 Stability of the relocated material. Maximum 20% of the total relocated quantity may have left the relocation site 2 weeks after completion of the relocation test. Between 20 and 40% of the material may disappear from the relocation site, if extreme conditions have led to this. Over 40% loss of material will be regarded as a failure of the test. | Two weeks after the end of relocation phase A, there is evidence of a limited material decrease (+0.5%), two weeks after relocation phase B no measurements were conducted but around 2 months after the relocation test, around 15% of the material had disappeared. After 2 weeks, therefore, less than 20% had disappeared. Figure 6 | |
| 1.2 Sedimentation of Schaar van Valkenisse. Maximum 15% of the transverse profile of the Schaar van Valkenisse (at the location of the bar that now lies at the head of the Schaar) may have been occupied by sand 2 weeks after the completion of the relocation test. | Two weeks after the end of relocation phase A, there is a limited decrease (-2.8% and -1.1% respectively) of the transverse profile for the 2 selected transverse sections. Two months after relocation phase B, there is a decrease of -7.1% and -5.2% respectively. This is, however, attributable to the targeted relocations that took place during the same period in the Schaar van Waarde. | |
| 2. Ecological criteria | ||
| 2.1 Height increases on the Walsoorden sandbar. On 25% of the sandbar more than 4 cm, on 50% of the sandbar more than 2 cm or on 100% of the sandbar more than 1 cm will be regarded as a problem. | Fixed point measurements indicated that the western edge of the sandbar was undergoing a reduction in height of 3.3 to 3.6 cm/year; the central part of the sandbar is increasing at a rate of 2.5 cm/year. This trend is also clear from the MOVE measurements. | |
| 2.2 Changes to percentage of inter-tidal mud. On 50% of the sandbar more than 40% change in the mud level or on 100% of the sandbar more than 20% change in the mud level will be regarded as a problem. | The granular analyses from samples taken on the sandbar indicate that there is no significant deviation as a result of the relocation test. Seasonal deviations in the mud level were clear from the measurements. | |
| 2.3 Changes in inter-tidal macrobenthos. The density, biomass and diversity of the inter-tidal macrobenthos may not deviate from the long-term trends. | No significant deviations of the inter-tidal macrobenthos were observed as a result of the relocation test. A shift towards a lower dynamic environment was observed but this was also the case in the control zone and cannot, therefore, be attributed to the relocation test. | |
(1) Morphological analysis
Morphological evolution relocation area (criterium 1)
The stability of the relocation test does fulfil the criteria: less than 20% of the total relocated quantity had left the relocation site two weeks after completion of the relocation test. Two weeks after the end of relocation phase A, there is evidence of a limited material decrease (-0.5%). Two weeks after relocation phase B no measurements were conducted but around 2 months after the relocation test, around 15% of the material had disappeared. The transportation of material out of the polygon is oriented towards the sandbar (Figure 5 & Figure 6) which was also the purpose of the relocation at a deeper and more dynamic area further from the sandbar. The larger depth was necessary for the trailing suction hoppers dredger and the relocation area was therefore also located further from the sandbar. This area is also characterized by a higher dynamism, both hydrodynamically (currents) as morphodynamically (sediment transports).
This trend becomes clearer from the long-term results. For phase A of the relocation test, 6 months after the execution of the test ca. 30% of the sediment is transported out of the polygon. For phase B ca. 35% of the relocated material is transported out of the control polygon after 10 months. At the end of 2007 only 50% (or circa 700,000 m³) of the relocation is still in the control polygon. Further analysis in 2008 even showed that in September 2008 (1.5 years after completion of the relocation test) 60% of the relocated material had disappeared [1]. Nevertheless this is a positive result since the material seems to have settled mainly between the relocation area and the sandbar (at the relocation area of 2004 and the area near the Walsoorden sandbar) (Figure 5 & Figure 6).
Criterium 2: Morphological trend at “Schaar van Waarde” and “Schaar van Valkenisse”
Transverse sections were selected at the Schaar van Waarde and Schaar van Valkenisse to control a potential effect of the relocation test: max. 15% of the transverse profiles may have been occupied by sand 2 weeks after the completion of the relocation test. The results show a positive trend: Two weeks after the end of relocation phase A, there was a limited decrease of the transverse profile for the 2 selected transverse sections (-2.8% and -1.1% respectively). Even two months after relocation phase B this criteria was met: the transverse profile decreased with 7.1% at Waarde and 5.2% at Valkenisse compared to the beginning of phase B. From then, the sedimentation at the Schaar van Valkenisse was stable: 6.1% after one year and 5.1% after 1.5 years since the beginning of phase B. Sedimentation at the Schaar van Waarde was however more intense: 5% after one year and 14.3% after 1.5 years since the beginning of phase B. This is, however, attributable to the targeted relocations that took place during the same period in the Schaar van Waarde.
(2) Ecological analysis
The ecological monitoring did not reveal any significant negative impact, neither in the intertidal areas, nor in the subtidal areas. None of the results from this monitoring indicated that the in situ relocation test was responsible for a significant change in ongoing trends. The result of this relocation test could however not be extrapolated to other areas because the effects could differ depending on local characteristics. For every relocation measure and for every area new location monitoring is needed (van der Wal 2010)!
In the intertidal area, no negative effects were detected due to the relocation test. All criteria were fulfilled and changes (mainly at the central part of the sandbank) were in line with the long term trends (elevation, sedimentation, marsh formation, and composition macrobenthos (Figure 7)). The trends in macrobenthos composition are however not similar for every species and based on the analysis of shifts in species diversity, the sandbar tends to shift towards a lower dynamic environment (Vos et al. 2009). This was also the case in the control zone and cannot, therefore, be attributed to the relocation test. The dominant intertidal macrobenthos species on the Walsoorden sandbank are presented in Figure 8.
In the subtidal area, the relocation test has resulted in a significant local change in the sediment composition: the mud content decreased at C1 and I1 (Figure 9). At the impact area I1 (corresponds to relocation area 2004) this trend was already visible during the monitoring of the 2004 monitoring program. From the new data, the development to more sandy sediment seems to continue. This was not really a surprise since the dredged material was poorer in mud content compared to the sediment that was present at the relocation area, and in addition dredging and relocation may lead to suspension of mud from which the relocated material could become even more poor in mud content. A comparable analysis for the new relocation area (I2) was not possible because sediment was not sampled before the relocation test and only two samples were taken in total.
At location I1, a significant decrease in macrobenthos biomass was measured (Figure 10). However, this was also measured at the control area C1 (as well as a decrease in diversity and density). The significant change was hence due to a general evolution and not due to the relocation test. This is surprising since the changes in sediment composition. This may be explained by the fact that the benthos community was already poor before the relocation test (Forster et al. 2006). The dominant subtidal macrobenthos species at Walsoorden are presented in Figure 11.
