
Disclaimer:
The authors are solely responsible for the content of this report. Material included herein does not represent the opinion of the European Community, and the European Community is not responsible for any use that might be made of it.
Back to overview measures
1. Morphological monitoring
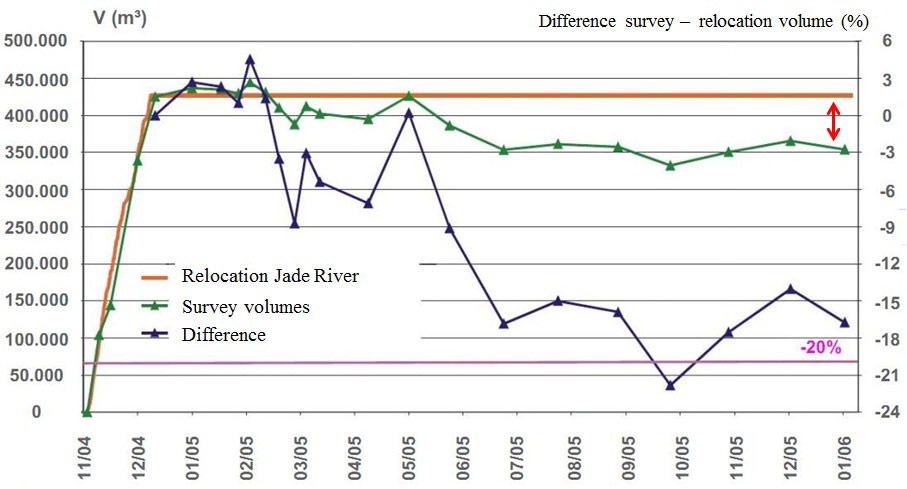
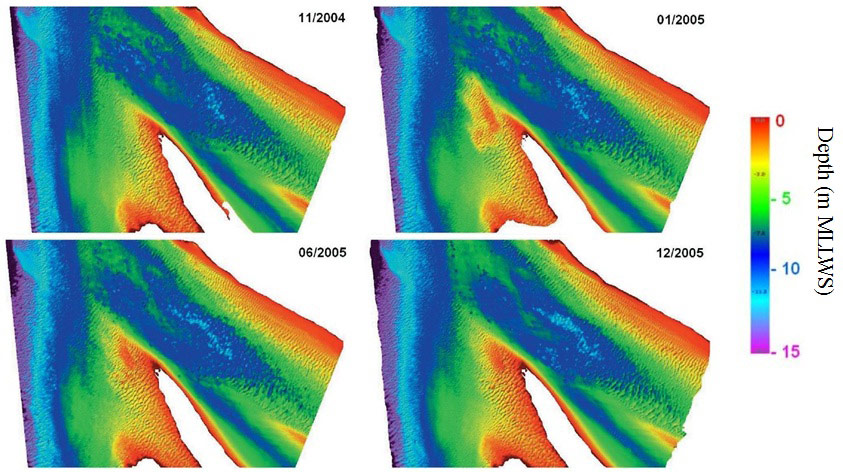
One year after the execution of the in situ relocation test, it was concluded that from morphological viewpoint the test was a success. Despite a small loss of sediment directly after execution of the relocation test, which is probably caused by the transport of the finer sands by the currents (i.e. natural segregation), the amount of material within the control area equalled the relocated quantities. Only after 2 months a decrease of volume was measured, a loss of circa 10% after 6 months and circa 17% after one year (Figure 5), which is much lower than the predefined criterium. The main part of the eroded sand is transported during flood towards the Walsoorden sandbar (Figure 6). This evolution is in agreement with the predictions of the feasibility study. Hence, a small shallow water area is created as a consequence of the relocation test. This shift towards the sandbar is desirable in terms of the objective of reconstructing the seaward tip of the Walsoorden sandbar.
2. Ecological monitoring
The ecological monitoring did not reveal any significant negative impact, neither in the intertidal areas, nor in the subtidal areas. None of the results from this monitoring indicated that the in situ relocation test was responsible for a significant change in ongoing trends. The result of this relocation test could however not be extrapolated to other areas. The effects could differ depending on local characteristics. For every relocation measure and for every area new location monitoring is needed (van der Wal 2010)!
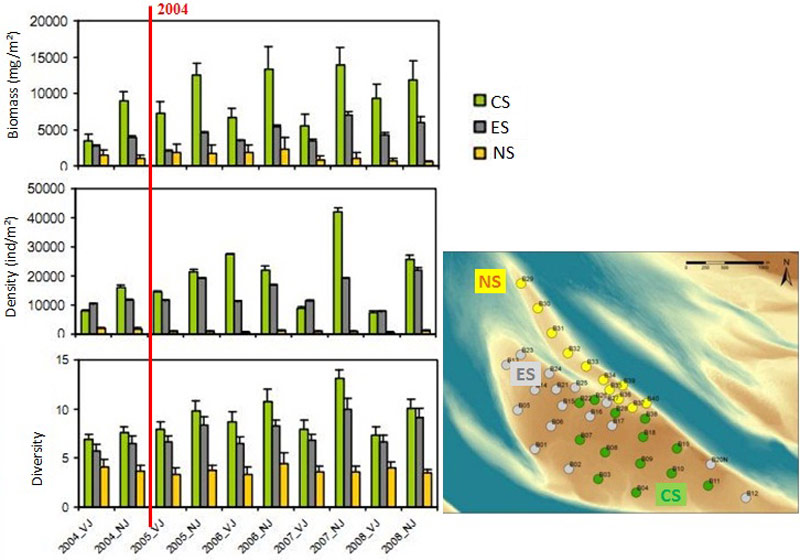
(1) Intertidal area. No negative effects due to the relocation test were detected. All criteria were met: elevation of the sandbar was in line with the long term trend, grain size and macrobenthos on the sandbar did also not deviate after the relocation test. Figure 7 shows results from the intertidal macrobenthos analysis.
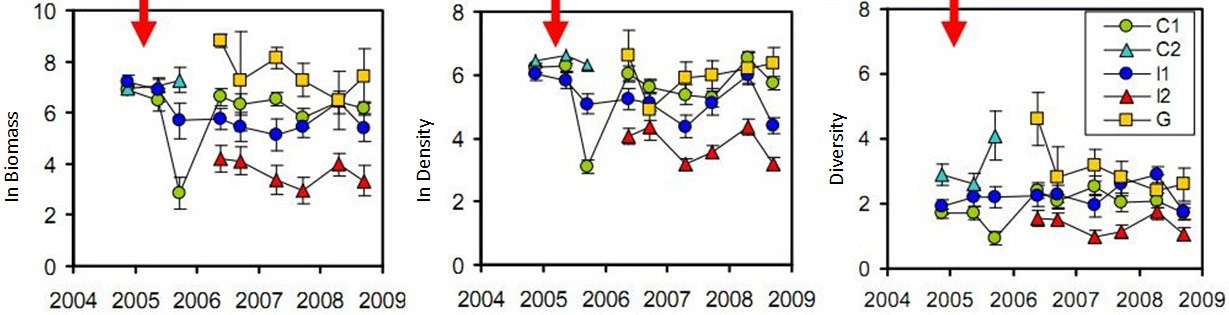
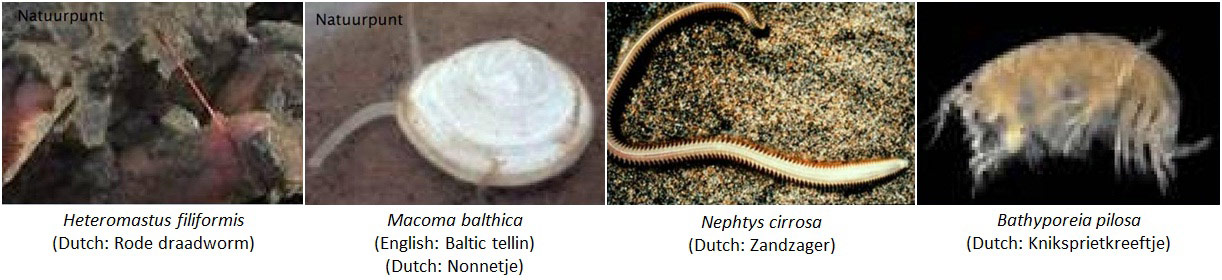
(2) Subtidal area. For the subtidal samples an initial decrease in mud-percentage was found for the impact area. This is explained by the absence of finer mud material in the dredged sediments that were relocated. The subtidal macrobenthos samples did however not show deterioration (biomass, diversity and density) for the impact area compared to the 2 other control areas (Figure 8). Assumably, this can be explained by the fact that the subtidal macrobenthos was already poor before the relocation test (Figure 9).
Back to top
Walsoorden pilot part A (2004): relocation of dredged sediment to a shallow water area at the edge of the Walsoorden sandbar
Table of content
- 1. Description of measure
- 1a. Measure description
- 1b. Monitoring
- 1c. Monitoring results
- 2. Execution of main effectiveness criteria
- 2a. Effectiveness according to development targets of measure
- 2b. Impact on ecosystem services
- 2c. Degree of synergistic effects and conflicts according to uses
- 3. Additional evaluation criteria in view of EU environmental law
- 3a. Degree of synergistic effects and conflicts according to WFD aims
- 3b. Degree of synergistic effects and conflicts according to Natura 2000 aims
- 4. Crux of the matter
- 5. References
Additional information
for this measure:
No further information available.
for this measure:
No further information available.
Monitoring results
Table 1. Overview of predefined morphological and ecological criteria and observed effects from the relocation test Walsoorden 2004 (WL 2006, Plancke and Ides 2007, Vos et al. 2009, Ides 2010, Vos 2010)| Predefined criteria | Observed effects |
| Morphology | |
| 1. Stability of the relocated material: Two weeks after relocating the dredged material, maximum 20% of the total relocated material may have left the relocation area. The test has failed if more than 40% of the total relocated material is lost. | The relocated material was very stable.
|
| 2. Sedimentation of “Schaar van Valkenisse”: Two weeks after relocating the dredged material, maximum 15% of the cross section of the Schaar van Valkenisse may be filled with sand. | No sedimentation took place at the “Schaar van Valkenisse”.
|
| Ecology | |
| 1. Elevation of sandbar Walsoorden: elevation with more than 40 cm at 25% of the sandbar, elevation with more than 2 cm at 50% of the sandbar, or elevation with more than 1 cm at 100% of the sandbar is seen as a problem. | The height of the sandbar showed no deviation as a result of the relocation test compared to long-term trends, a mean elevation of 2.2 up to 2.9 cm per year was measured. This is the trend as determined from the MOVE measurements. |
| 2. Change in percentage intertidal sludge: change in mud-concentration of more than 40% at 50% of the sandbar, or a change of more than 20% at 100% of the sandbar is seen as a problem. | The granulometry of the sandbar showed no deviation as a result of the relocation test. Seasonal fluctuations were slightly observed: larger grain size in winter, smaller grain size in summer and autumn. A sub-tidal effect was established as a result of the relocation test: the sediment composition in the impact zone was slightly altered (decrease in mud- and semi-coarse sand-percentage, increase of sand and fine sand fraction). This was a result of a difference in granular size between the relocated material and the sediment that was initially present at the relocation site. |
| 3. Change in intertidal macrobenthos: the density, biomass, and diversity of intertidal macrobenthos may not deviate from the long term trends. | Both intertidal and subtidal macrobenthos in the study area showed no deviation as a result of the relocation area (not in diversity, biomass and density). Seasonal trends were observed: autumn > spring. Only an increase in intertidal biomass was significant (van der Wal 2010). Also a change in the composition of macrobenthos species was observed: less B. pilosa and more H. filiformis, N. diversicolor and P. elegans (van der Wal 2010). |
1. Morphological monitoring
One year after the execution of the in situ relocation test, it was concluded that from morphological viewpoint the test was a success. Despite a small loss of sediment directly after execution of the relocation test, which is probably caused by the transport of the finer sands by the currents (i.e. natural segregation), the amount of material within the control area equalled the relocated quantities. Only after 2 months a decrease of volume was measured, a loss of circa 10% after 6 months and circa 17% after one year (Figure 5), which is much lower than the predefined criterium. The main part of the eroded sand is transported during flood towards the Walsoorden sandbar (Figure 6). This evolution is in agreement with the predictions of the feasibility study. Hence, a small shallow water area is created as a consequence of the relocation test. This shift towards the sandbar is desirable in terms of the objective of reconstructing the seaward tip of the Walsoorden sandbar.
2. Ecological monitoring
The ecological monitoring did not reveal any significant negative impact, neither in the intertidal areas, nor in the subtidal areas. None of the results from this monitoring indicated that the in situ relocation test was responsible for a significant change in ongoing trends. The result of this relocation test could however not be extrapolated to other areas. The effects could differ depending on local characteristics. For every relocation measure and for every area new location monitoring is needed (van der Wal 2010)!
(1) Intertidal area. No negative effects due to the relocation test were detected. All criteria were met: elevation of the sandbar was in line with the long term trend, grain size and macrobenthos on the sandbar did also not deviate after the relocation test. Figure 7 shows results from the intertidal macrobenthos analysis.
(2) Subtidal area. For the subtidal samples an initial decrease in mud-percentage was found for the impact area. This is explained by the absence of finer mud material in the dredged sediments that were relocated. The subtidal macrobenthos samples did however not show deterioration (biomass, diversity and density) for the impact area compared to the 2 other control areas (Figure 8). Assumably, this can be explained by the fact that the subtidal macrobenthos was already poor before the relocation test (Figure 9).