

Disclaimer:
The authors are solely responsible for the content of this report. Material included herein does not represent the opinion of the European Community, and the European Community is not responsible for any use that might be made of it.
Back to overview measures
Sedimentation-erosion processes are very local specific since the combination of the shape index, the presence of peat layers and the very varied topography of the site along its length resulted in varied exposure and resistance to wave action (tidal, wind and from ships) across the site. Detailed graphs with elevation profiles and sedimentation/erosion results per transect can be found in attachment A.
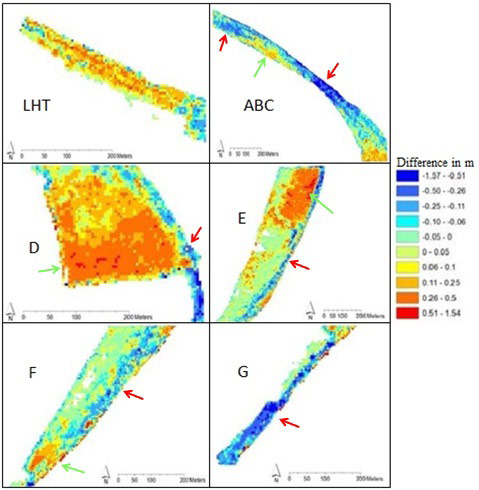
In general, sedimentation and erosion processes strongly vary in the study area (Table 2), as well in the different zones of the area (Figure 5). Net sedimentation and erosion both varied between 0 and 30cm in the first year after restoration (Van den Bergh 2005) and between 0 and 15cm per year between November 2003 and August 2005 (Van den Bergh 2005).
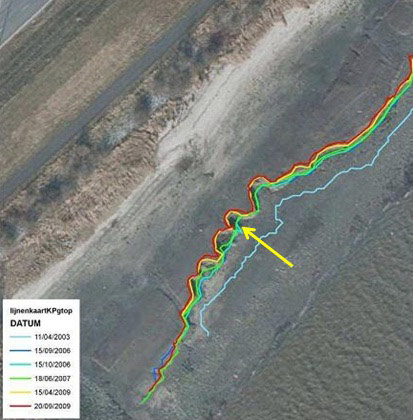
Minimal changes were noticed at the supratidal stations Kpf1 and Kpe1. The more exposed intertidal stations clearly eroded (Kpa1, Kpb2, Kpc2, Kpd4 and Kpe5). The lower and sheltered stations (Kpd1-3 and Kpe2-4) showed a clear net sedimentation; at these stations some depressions filled up relatively quickly. Sedimentation and erosion generally occurred gradually, however some ‘sudden’ net erosion of more than 10cm between two consecutive measurements was observed in the very low and exposed sampling stations (Van den Bergh 2005). The top of the cliff (site G) moved land inwards as a consequence of erosion (Figure 6), already up to 2m in less than 6 months (Van den Bergh 2005).
Based on the sedimentation-erosion measurements in the different zones and some geomorphological variables, relations were studied. But a causal relation was only observed between the percentage of slope grade of the mudflat and the intensity of sedimentation/erosion (Van den Neucker et al. 2007, Speybroeck et al. 2011). Sedimentation shifts to erosion from a slope grade of 2.5% or more (Van den Neucker et al. 2007). Indeed, zone ABC and G are characterised by a steep slope by the construction work (Table 1) and globally under influence of erosion (Table 2). In zone DEF erosion is mainly restricted to the shoreline (Figure 5).
Table 2. Sedimentation and erosion per zone per year (cm/y, data November 2003 – August 2005) and the effect on the relative flood frequency (Van den Neucker et al. 2007)
(2) Creek network system
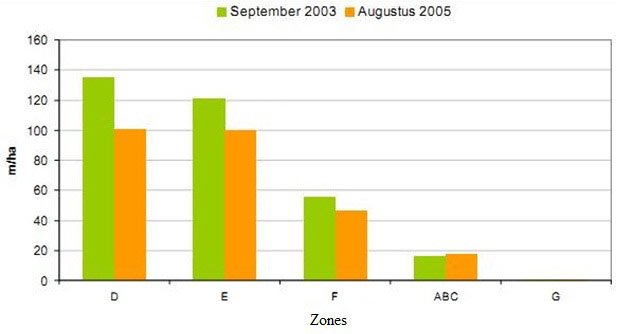
The creek network is important for wetland development because they arrange water supply and drainage, for the supply of seeds and also as habitat for organisms like crustaceans (Crustacea), fish and other (Van den Neucker et al. 2007). The onset for a creek network system established relatively quickly in the wider and sheltered D and E sections of the Ketenisse marsh where sedimentation was observed (Van den Bergh 2005, Van den Neucker et al. 2007). In zone F the creek network system established moderately and in ABC it established badly (Figure 7 & Figure 8). Once established the main channels did not alter their position very much but the sinuosity seemed to increase very gradually (Van den Bergh 2005). Between 2003 and 2005 the density (m/ha) decreased in zone DEF but not in ABC (Figure 8).
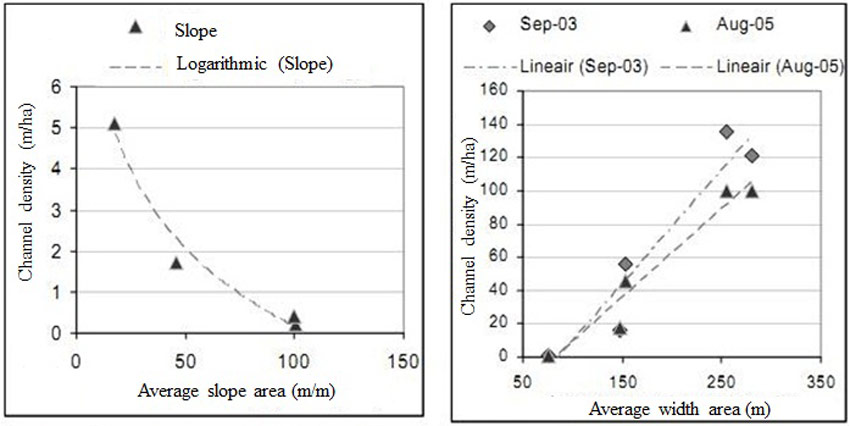
Two relationships were observed at the Ketenisse marsh: an exponential decreasing relation between channel- and creek density and slope; and a linear increasing relation between channel density and the average width of the area (Figure 9). So besides an opportune slope, also sufficient space is necessary for channel and creek development (Van den Neucker et al. 2007). Zone D and E are the most width zones of the study area and have also the most channel and creek development (D: 255.2m; E: 280.6m). Zone F has an average width of 153.8m, while zone ABC is a long small zone with an average width of 75.7m.
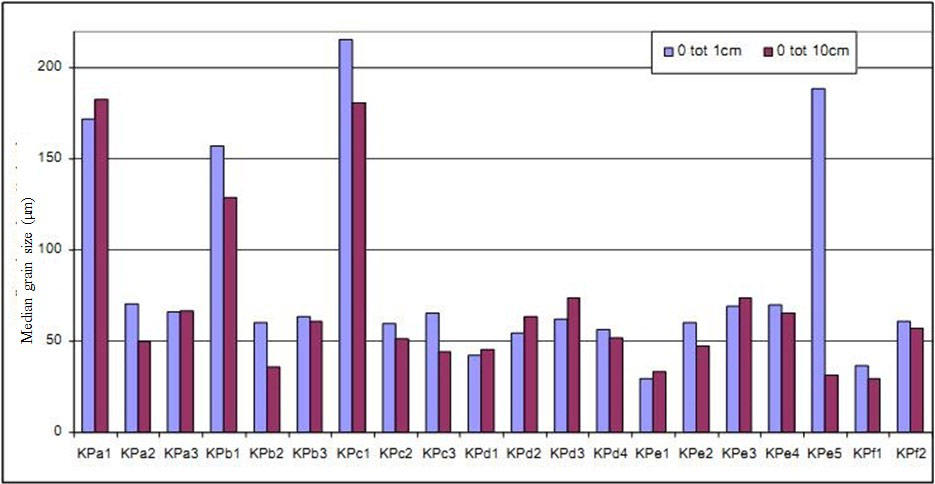
Median grain size (MGS) showed large variation and organic carbon content of the sediment varied between 0.5 and 15% and was closely related to sediment median grain size (Van den Bergh 2005). The more sheltered stations along the D and E transects with the highest net sedimentation rates were also the muddiest, with a lower MGS (fine sediment) (Figure 10). At the F stations, which were not levelled merely because of the high mud content, MGS was also relatively low (fine sediment). The erosive sampling stations were generally sandier. Along the narrow upstream part (at section ABC) MGS increases with elevation. Sediment composition along the B transect showed large variations, changing from fine to rather sandy sediments in a few weeks’ time. These changes were probably related to occasional dredging activities on the nearby ‘plaat van Lillo’. A close relationship was found between MGS and organic matter content of the sediment. No relationship was found between mean %OM and net sedimentation/erosion over the first year (Van den Bergh 2005). Differences in organic matter content between the upper (0-1cm) and lower layer (0-10cm) are small, i.e. small difference between new and old sediment.
Sediment quality
At Ketenisse marsh some strong and extreme contaminated sites were observed (Figure 11), mainly due to high concentrations of mercury and cadmium (Speybroeck et al. 2011). The most contaminated sites are KPd4, KPf1 and (some less frequent) KPe5, while at KPb3 only one global score was strongly contaminated. Those sites are randomly spread over the area, but except for one (KPf1) it are all low intertidal locations. In all four sites the contamination is historical. Erosion at those sites would increase the pollution concentrations.
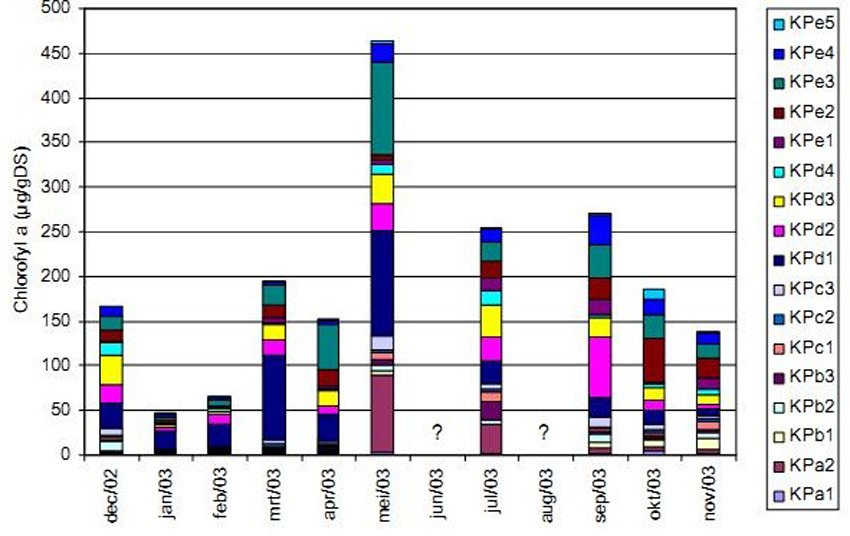
Microphytobenthos is known to play an important role in the stabilisation of intertidal sediments (Stal 2003, Van den Bergh 2005) and gives an indication for benthic primary production (Van den Neucker et al. 2007). At the Ketenisse marsh it was only measured in the first year after the restoration of the area. Chlorophyll a concentrations varied between 0.3 and 118µg.g sediment dry weight-1 with the highest values found on sections D and E (Van den Bergh 2005). They were comparable concentrations found on Groot Buitenschoor, a mudflat situated nearby (Van den Bergh 2005). The highest concentration chlorophyll a was observed during spring and summer (Van den Bergh 2005, Van den Neucker et al. 2007), but the moment of maximum chlorophyll production was not similar for every location (Figure 12). This is in agreement with previous studies in the Scheldt Estuary (De Jong and De Jonge 1995, Van den Bergh 2005).
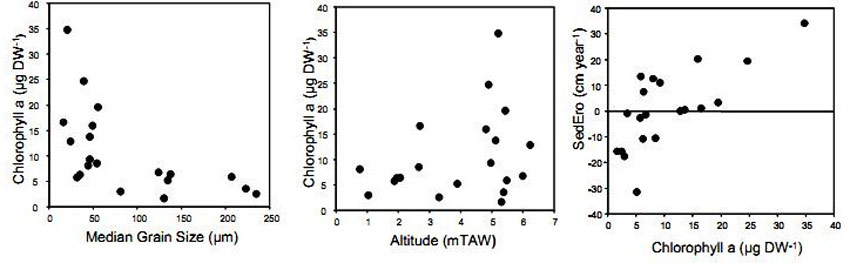
The highest concentration chlorophyll a was observed in finer sediments (Van den Bergh 2005, Van den Neucker et al. 2007) (Figure 13). Moreover, higher concentrations were also observed in sediment at high elevated areas (Van den Bergh 2005, Van den Neucker et al. 2007) (Figure 13). Although transects E and F were only levelled between November 2002 and January 2003, chlorophyll a concentrations were not significantly lower than in the other transects. This indicates that microphytobenthos populations can rapidly colonize newly constructed mudflats (Van den Bergh 2005). Finally, a close relationship was found between the chlorophyll a concentration in the upper soil layer (0-1cm) and sedimentation-erosion rates (Van den Bergh 2005) (Figure 13). Chlorophyll a concentration might therefore be a potential indicator for sedimentation and erosion in newly created marshes (Van den Bergh 2005).
Macrobenthos
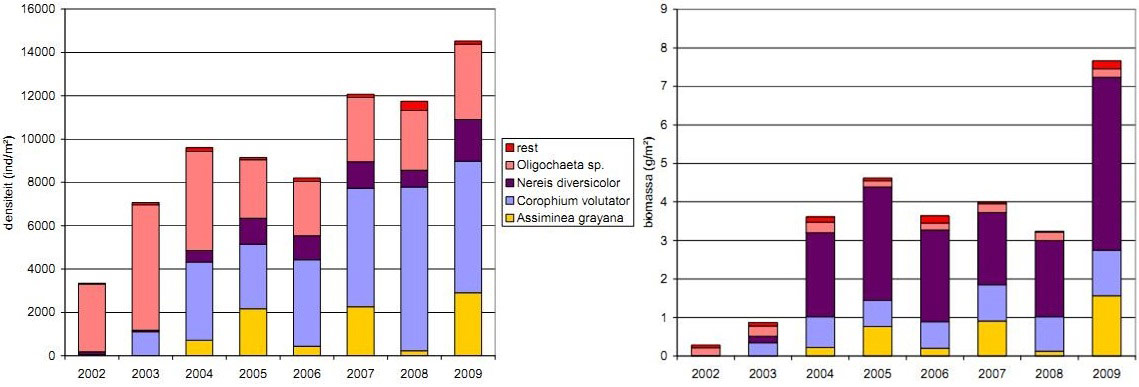
During the entire monitoring period (2002-2009) benthos fauna was dominated by mud shrimp (44%, Corophium volutator) and earthworms (44%, Oligochaeta), followed by Common ragworm (9%, Nereis diversicolor) and Dun Sentinel (2%, Assiminea grayana) (Figure 14) (Speybroeck et al. 2011). Other species represented only 1% of the benthic fauna. However, in biomass Oligochaeta are less important. Biomass is dominated by Common ragworm and to a lesser extent by mud shrimp and the more marsh related Dun Sentinel (Figure 14) (Speybroeck et al. 2011).
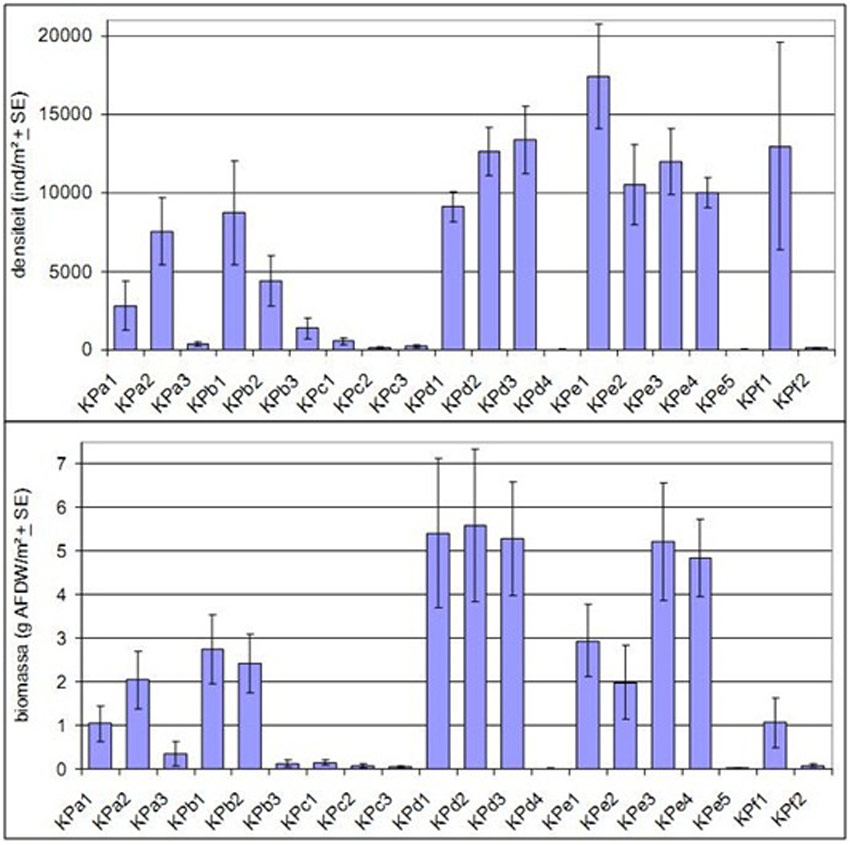
The different transects and sample locations differ clearly in density and biomass (Figure 15) (Speybroeck et al. 2011). The benthos density in the higher elevated locations of KPa and b are lower than at KPd and e, but the difference is clearer for biomass. Transect C is poor for all benthos aspects (diversity, density, biomass). Whereas the steeper KPf transect has low benthos density and –biomass, the flatter parts of KPd and KPe are rich in benthos and offer more fouraging potential for birds. At each transect the lower values are observed at the low locations (KPa3, KPb3, KPc3, KPd4, KPe5, KPf2). This corresponds with the general pattern of the Sea Scheldt where high(er) values were observed at the high and mean high intertidal locations, while the low values in the lower parts of the intertidal are comparable with the values in the subtidal part (Speybroeck et al., unpublished data, in (Speybroeck et al. 2011)). Another explanation is that the low intertidal locations were more contaminated and are hence possibly toxic for macroinvertebrates (Speybroeck et al. 2011).
The average density and average biomass of macrobenthos was on the original mudflat much lower compared to the restored part (Van den Neucker et al. 2007). From these results it seems that erosion sensitive locations are characterised by poor benthos communities (Speybroeck et al. 2011). Also a higher slope, larger grain size and larger dynamisms seems to be characteristic for zones with poor benthos both in number of species as in individuals. These are also explanations (steep, erosion and large grain size) for the relatively low development of benthic fauna at the zone ABC (Figure 15), hence this zone was not successful to create an optimal starting situation for marsh development.
Oligochaeta
Total Oligochaeta fauna exist mainly of 6 taxa: Paranais litoralis (21%), Enchytraeidae (17%), Lumbricillus lineatus (17%), Tubificoides heterochaetus (17%), Heterochaeta costata (14%) and Amphichaeta sannio (12%) (Speybroeck et al. 2011). At the restored area, the number of taxa increased during the monitoring period (2002-2005) (Van den Neucker et al. 2007). The number of taxa at the original mudflat strongly fluctuated and at location KPf1, between remains of the original marsh, the number of taxa remained rather stable. At the original mudflat the density of oligochaeta was in general much smaller compared to the restored area (Van den Neucker et al. 2007). At the restored area P. litoralis was the most dominant taxa, while at the original mudflat T. heterochaetus was more abundant (Van den Neucker et al. 2007).
The presence of various Oligochaeta taxa can be linked with different habitat types (Speybroeck et al. 2011). Enchytraeidae is mainly observed in the higher zones with marsh development (eg. along transects E and F). Tubificiodes heterochaetus is almost not observed in marshes but mainly at lower muddy locations. Heterochaeta costata is also not observed in marshes but also not at lower sandy locations. This taxa is mainly observed in good developed mudflat without vegetation. Also Amphichaeta sannio seems to have similar habitat requirements.
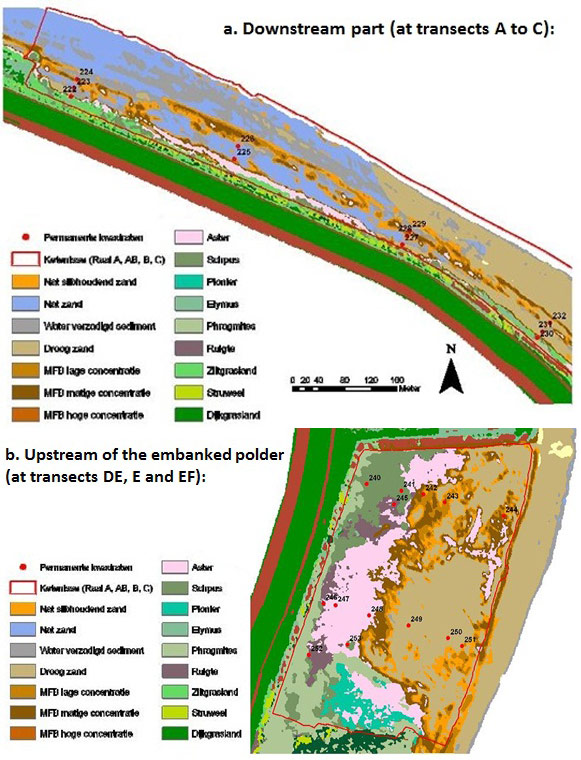
Two vegetation maps of Ketenisse are presented (Figure 16). The most downstream zone (at transects ABC) is characterised by a steep slope (>2.8%) with consequently erosion and regressive succession (almost no marsh vegetation) (Speybroeck et al. 2011). Only at the higher parts, close to the dike, elevation occurs by Aeolian deposition (by the wind). As a consequence some vegetation is present close to the dike: Sea Aster (Aster tripolium), Sea clubrush (Scirpus maritimus), Sea Couch (Elymus athericus) or Common reed (Phragmites australis). Supratidal a plant community developed with Buck's-horn plantain (Plantago coronopus), Creeping bentgrass (Agrostis stolonifera), Celery (Apium graveolens), Sea-milkwort (Glaux maritime) and Sea aster as aspect determining species between which also Sea hard-grass (Parpholis strigosa) can be found. Most part is however bare soil (wet sand, wet muddy sand, dry sand and water-saturated sediment) or covered with Vaucheria (Vaucheria sp.) or Microphytobenthos (MFB) (Figure 16).
In the zone upstream of the embanked polder (at transects DE and E) the slope is flat enough for sedimentation (<2.8%) and consequently progressive succession (marsh development) (Speybroeck et al. 2011). From East to West there is a gradient from low to high. At the lowest part the bare mudflat is colonised by Vaucheria (Vaucheria sp.), followed by Sea Aster (Aster tripolium) and Sea clubrush (scirpus maritimus) and in the end Common Reed (Phragmites australis) (Speybroeck et al. 2011).
The most upstream part (EF) is similar as zone ABC.
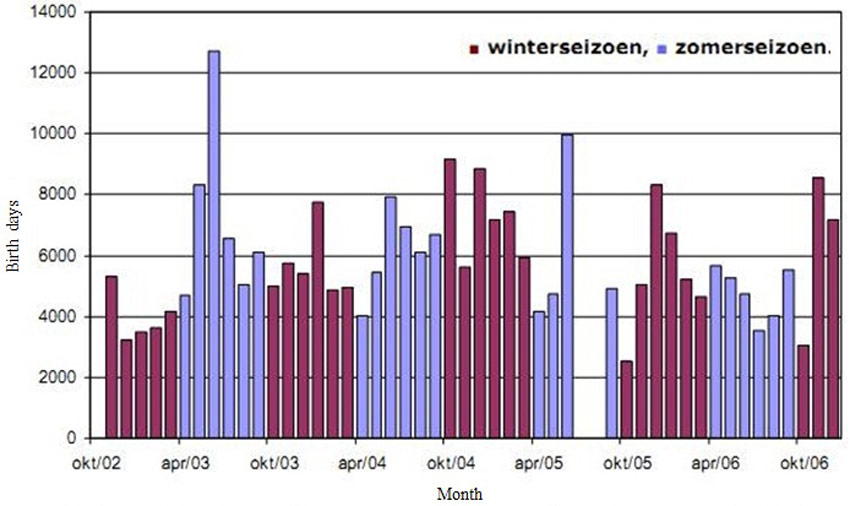
In total 46 water bird species were observed on Ketenisse during the monitoring period November 2002 and December 2006 (Van den Neucker et al. 2007). Number of bird days was used as unit for the bird monitoring. The number of bird days varied between 2500 and 12750 per month (2002-2006) (Figure 17) (Van den Neucker et al. 2007). The maximum of bird days was counted in June 2003 and June 2005, respectively due to the very high abundance of Common Shelduck and Lapwing (Van den Neucker et al. 2007). A positive trend was observed for the total number of bird days per season during the first three winter seasons (Figure 17).
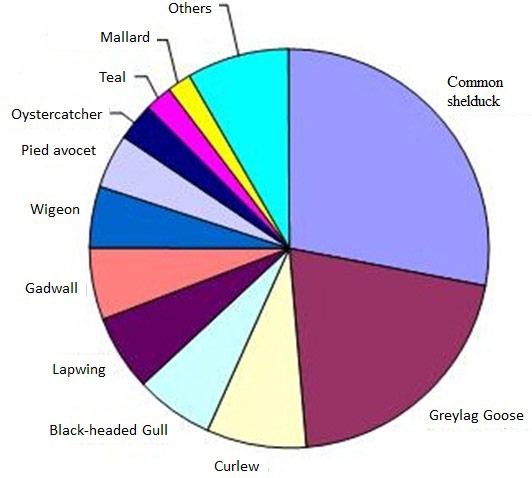
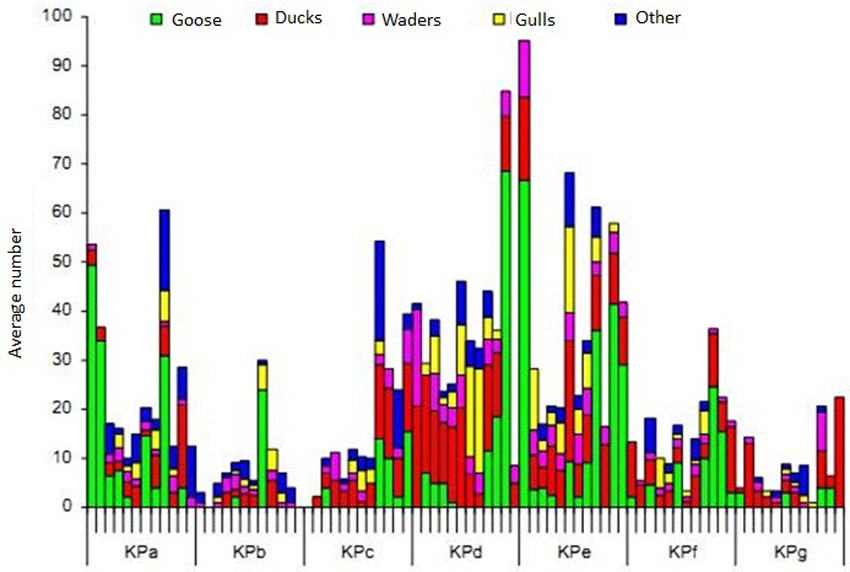
The most numerous species were Common Shelduck (Tadorna tadorna), Greylag Goose (Anser anser), Pied Avocet (Recurvirostra avosetta) responsible for 31%, 18% and 9% of the total number of bird days and all of them are typical species for the mesohaline part of the estuary (Figure 18) (Van den Bergh 2005, Van den Neucker et al. 2007). On average, the largest number of birds was observed on the restored parts of zones D and E (KPd and KPe) (Figure 19) (Van den Neucker et al. 2007). Common Shelduck and Pied Avocet (Recurvirostra avosetta) feed on the more sheltered, low dynamic mudflats in KPd and KPe and breed on their highest parts. Greylag Goose feed on the Scirpus maritimus vegetation in these sections and rest on the mudflats. Lapwing (Vanellus vanellus), Gadwall (Anas strepera) and the migrating waders are more common on the sandier sections (kpa, kpb, kpc, kpf en kpg). Curlew (Numenius arquata) was found in all sections (Van den Bergh 2005). Overall, geese are typical winter guests, Common Shelduck and Pied Avocet are especially abundant in summer.
Breeding birds
The most abundant breeding birds on Ketenisse are some typical species for marsh habitat, like Common Redshank (Tringa tetanus) and Common Shelduck (Tadorna tadorna) (Van den Neucker et al. 2007). The Reed vegetation seemed a good breeding habitat for Eurasian Reed Warbler (Acrocephalus scirpaceus), Reed Bunting (Emberiza schoeniclus) and Bluethroat (Luscinia svecica). The Sigmadike is also used for breeding by Meadow Pipit (Anthus pratensis), Eurasian Skylark (Alauda arvensis) and Little Ringed Plover (Charadrius dubius).
The expansion of reed vegetation in the southern part of Ketenisse had led to the immediate colonisation by species such as Reed Bunting, Bluethroat, Eurasian Reed Warbler and Marsh Warbler (Acrocephalus palustris). This fast colonisation was probably also catalysed by the habitat loss at the inner side of the Sigmadike along the Ketenisroad.
During the period 2004 to 2006 remarkably less numbers of waders were observed to breed on Ketenisse. For Pied Avocet (Recurvirostra avosetta) and Little Ringed Plover (Charadrius dubius) this was possibly due to the advanced succession stadium of marsh vegetation. Only on the grass strip (not embanked zone LHT in the north of Ketenisse) and in the little polder between zone D and E, the number of waders remained stable. The number of waders decreased as a consequence of the development of large Reedbeds, in particular in the southern part.
Back to top
Ketenisse wetland - small scale tidal wetland restoration in the brackish part of the estuary
Table of content
- 1. Description of measure
- 1a. Measure description
- 1b. Monitoring
- 1c. Monitoring results
- 2. Execution of main effectiveness criteria
- 2a. Effectiveness according to development targets of measure
- 2b. Impact on ecosystem services
- 2c. Degree of synergistic effects and conflicts according to uses
- 3. Additional evaluation criteria in view of EU environmental law
- 3a. Degree of synergistic effects and conflicts according to WFD aims
- 3b. Degree of synergistic effects and conflicts according to Natura 2000 aims
- 4. Crux of the matter
- 5. References
Additional information
for this measure:
No further information available.
for this measure:
No further information available.
Monitoring results
Geomorphological changes
Sedimentation-erosionSedimentation-erosion processes are very local specific since the combination of the shape index, the presence of peat layers and the very varied topography of the site along its length resulted in varied exposure and resistance to wave action (tidal, wind and from ships) across the site. Detailed graphs with elevation profiles and sedimentation/erosion results per transect can be found in attachment A.
In general, sedimentation and erosion processes strongly vary in the study area (Table 2), as well in the different zones of the area (Figure 5). Net sedimentation and erosion both varied between 0 and 30cm in the first year after restoration (Van den Bergh 2005) and between 0 and 15cm per year between November 2003 and August 2005 (Van den Bergh 2005).
Minimal changes were noticed at the supratidal stations Kpf1 and Kpe1. The more exposed intertidal stations clearly eroded (Kpa1, Kpb2, Kpc2, Kpd4 and Kpe5). The lower and sheltered stations (Kpd1-3 and Kpe2-4) showed a clear net sedimentation; at these stations some depressions filled up relatively quickly. Sedimentation and erosion generally occurred gradually, however some ‘sudden’ net erosion of more than 10cm between two consecutive measurements was observed in the very low and exposed sampling stations (Van den Bergh 2005). The top of the cliff (site G) moved land inwards as a consequence of erosion (Figure 6), already up to 2m in less than 6 months (Van den Bergh 2005).
Based on the sedimentation-erosion measurements in the different zones and some geomorphological variables, relations were studied. But a causal relation was only observed between the percentage of slope grade of the mudflat and the intensity of sedimentation/erosion (Van den Neucker et al. 2007, Speybroeck et al. 2011). Sedimentation shifts to erosion from a slope grade of 2.5% or more (Van den Neucker et al. 2007). Indeed, zone ABC and G are characterised by a steep slope by the construction work (Table 1) and globally under influence of erosion (Table 2). In zone DEF erosion is mainly restricted to the shoreline (Figure 5).
Table 2. Sedimentation and erosion per zone per year (cm/y, data November 2003 – August 2005) and the effect on the relative flood frequency (Van den Neucker et al. 2007)
| Zone | Erosion - sedimentation (cm/y) | Change in relative flood frequency (%) |
| LHT | +5 | ? |
| ABC | -6 | From 92% to 94% |
| D | +15 | From 99% to 96% |
| E | +6 | From 68% to 63% |
| F | -2 | From 70% to 72% |
| G | -7 | From 98% to 100% |
(2) Creek network system
The creek network is important for wetland development because they arrange water supply and drainage, for the supply of seeds and also as habitat for organisms like crustaceans (Crustacea), fish and other (Van den Neucker et al. 2007). The onset for a creek network system established relatively quickly in the wider and sheltered D and E sections of the Ketenisse marsh where sedimentation was observed (Van den Bergh 2005, Van den Neucker et al. 2007). In zone F the creek network system established moderately and in ABC it established badly (Figure 7 & Figure 8). Once established the main channels did not alter their position very much but the sinuosity seemed to increase very gradually (Van den Bergh 2005). Between 2003 and 2005 the density (m/ha) decreased in zone DEF but not in ABC (Figure 8).
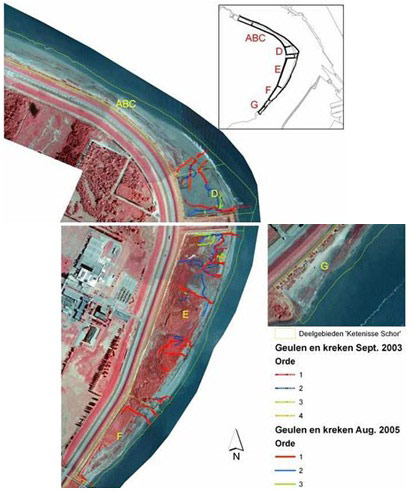
Two relationships were observed at the Ketenisse marsh: an exponential decreasing relation between channel- and creek density and slope; and a linear increasing relation between channel density and the average width of the area (Figure 9). So besides an opportune slope, also sufficient space is necessary for channel and creek development (Van den Neucker et al. 2007). Zone D and E are the most width zones of the study area and have also the most channel and creek development (D: 255.2m; E: 280.6m). Zone F has an average width of 153.8m, while zone ABC is a long small zone with an average width of 75.7m.
Sediment characteristics
Median grain size and organic carbon contentMedian grain size (MGS) showed large variation and organic carbon content of the sediment varied between 0.5 and 15% and was closely related to sediment median grain size (Van den Bergh 2005). The more sheltered stations along the D and E transects with the highest net sedimentation rates were also the muddiest, with a lower MGS (fine sediment) (Figure 10). At the F stations, which were not levelled merely because of the high mud content, MGS was also relatively low (fine sediment). The erosive sampling stations were generally sandier. Along the narrow upstream part (at section ABC) MGS increases with elevation. Sediment composition along the B transect showed large variations, changing from fine to rather sandy sediments in a few weeks’ time. These changes were probably related to occasional dredging activities on the nearby ‘plaat van Lillo’. A close relationship was found between MGS and organic matter content of the sediment. No relationship was found between mean %OM and net sedimentation/erosion over the first year (Van den Bergh 2005). Differences in organic matter content between the upper (0-1cm) and lower layer (0-10cm) are small, i.e. small difference between new and old sediment.
Sediment quality
At Ketenisse marsh some strong and extreme contaminated sites were observed (Figure 11), mainly due to high concentrations of mercury and cadmium (Speybroeck et al. 2011). The most contaminated sites are KPd4, KPf1 and (some less frequent) KPe5, while at KPb3 only one global score was strongly contaminated. Those sites are randomly spread over the area, but except for one (KPf1) it are all low intertidal locations. In all four sites the contamination is historical. Erosion at those sites would increase the pollution concentrations.
Benthos
MicrophytobenthosMicrophytobenthos is known to play an important role in the stabilisation of intertidal sediments (Stal 2003, Van den Bergh 2005) and gives an indication for benthic primary production (Van den Neucker et al. 2007). At the Ketenisse marsh it was only measured in the first year after the restoration of the area. Chlorophyll a concentrations varied between 0.3 and 118µg.g sediment dry weight-1 with the highest values found on sections D and E (Van den Bergh 2005). They were comparable concentrations found on Groot Buitenschoor, a mudflat situated nearby (Van den Bergh 2005). The highest concentration chlorophyll a was observed during spring and summer (Van den Bergh 2005, Van den Neucker et al. 2007), but the moment of maximum chlorophyll production was not similar for every location (Figure 12). This is in agreement with previous studies in the Scheldt Estuary (De Jong and De Jonge 1995, Van den Bergh 2005).
The highest concentration chlorophyll a was observed in finer sediments (Van den Bergh 2005, Van den Neucker et al. 2007) (Figure 13). Moreover, higher concentrations were also observed in sediment at high elevated areas (Van den Bergh 2005, Van den Neucker et al. 2007) (Figure 13). Although transects E and F were only levelled between November 2002 and January 2003, chlorophyll a concentrations were not significantly lower than in the other transects. This indicates that microphytobenthos populations can rapidly colonize newly constructed mudflats (Van den Bergh 2005). Finally, a close relationship was found between the chlorophyll a concentration in the upper soil layer (0-1cm) and sedimentation-erosion rates (Van den Bergh 2005) (Figure 13). Chlorophyll a concentration might therefore be a potential indicator for sedimentation and erosion in newly created marshes (Van den Bergh 2005).
Macrobenthos
During the entire monitoring period (2002-2009) benthos fauna was dominated by mud shrimp (44%, Corophium volutator) and earthworms (44%, Oligochaeta), followed by Common ragworm (9%, Nereis diversicolor) and Dun Sentinel (2%, Assiminea grayana) (Figure 14) (Speybroeck et al. 2011). Other species represented only 1% of the benthic fauna. However, in biomass Oligochaeta are less important. Biomass is dominated by Common ragworm and to a lesser extent by mud shrimp and the more marsh related Dun Sentinel (Figure 14) (Speybroeck et al. 2011).
The different transects and sample locations differ clearly in density and biomass (Figure 15) (Speybroeck et al. 2011). The benthos density in the higher elevated locations of KPa and b are lower than at KPd and e, but the difference is clearer for biomass. Transect C is poor for all benthos aspects (diversity, density, biomass). Whereas the steeper KPf transect has low benthos density and –biomass, the flatter parts of KPd and KPe are rich in benthos and offer more fouraging potential for birds. At each transect the lower values are observed at the low locations (KPa3, KPb3, KPc3, KPd4, KPe5, KPf2). This corresponds with the general pattern of the Sea Scheldt where high(er) values were observed at the high and mean high intertidal locations, while the low values in the lower parts of the intertidal are comparable with the values in the subtidal part (Speybroeck et al., unpublished data, in (Speybroeck et al. 2011)). Another explanation is that the low intertidal locations were more contaminated and are hence possibly toxic for macroinvertebrates (Speybroeck et al. 2011).
The average density and average biomass of macrobenthos was on the original mudflat much lower compared to the restored part (Van den Neucker et al. 2007). From these results it seems that erosion sensitive locations are characterised by poor benthos communities (Speybroeck et al. 2011). Also a higher slope, larger grain size and larger dynamisms seems to be characteristic for zones with poor benthos both in number of species as in individuals. These are also explanations (steep, erosion and large grain size) for the relatively low development of benthic fauna at the zone ABC (Figure 15), hence this zone was not successful to create an optimal starting situation for marsh development.
Oligochaeta
Total Oligochaeta fauna exist mainly of 6 taxa: Paranais litoralis (21%), Enchytraeidae (17%), Lumbricillus lineatus (17%), Tubificoides heterochaetus (17%), Heterochaeta costata (14%) and Amphichaeta sannio (12%) (Speybroeck et al. 2011). At the restored area, the number of taxa increased during the monitoring period (2002-2005) (Van den Neucker et al. 2007). The number of taxa at the original mudflat strongly fluctuated and at location KPf1, between remains of the original marsh, the number of taxa remained rather stable. At the original mudflat the density of oligochaeta was in general much smaller compared to the restored area (Van den Neucker et al. 2007). At the restored area P. litoralis was the most dominant taxa, while at the original mudflat T. heterochaetus was more abundant (Van den Neucker et al. 2007).
The presence of various Oligochaeta taxa can be linked with different habitat types (Speybroeck et al. 2011). Enchytraeidae is mainly observed in the higher zones with marsh development (eg. along transects E and F). Tubificiodes heterochaetus is almost not observed in marshes but mainly at lower muddy locations. Heterochaeta costata is also not observed in marshes but also not at lower sandy locations. This taxa is mainly observed in good developed mudflat without vegetation. Also Amphichaeta sannio seems to have similar habitat requirements.
Vegetation
Just like for benthos are the present morphologic processes responsible for the vegetation succession and colonisation: locations with sedimentation are characterised by progressive succession and locations with erosion by regressive succession (Speybroeck et al. 2011). In addition, the relative flood frequency determines possibilities for vegetation and fauna development. For Ketenisse this means that pioneerecotopes are located between 5m and 5.4mTAW and all zones above 5.4mTAW that are vegetated are marsh ecotopes.Two vegetation maps of Ketenisse are presented (Figure 16). The most downstream zone (at transects ABC) is characterised by a steep slope (>2.8%) with consequently erosion and regressive succession (almost no marsh vegetation) (Speybroeck et al. 2011). Only at the higher parts, close to the dike, elevation occurs by Aeolian deposition (by the wind). As a consequence some vegetation is present close to the dike: Sea Aster (Aster tripolium), Sea clubrush (Scirpus maritimus), Sea Couch (Elymus athericus) or Common reed (Phragmites australis). Supratidal a plant community developed with Buck's-horn plantain (Plantago coronopus), Creeping bentgrass (Agrostis stolonifera), Celery (Apium graveolens), Sea-milkwort (Glaux maritime) and Sea aster as aspect determining species between which also Sea hard-grass (Parpholis strigosa) can be found. Most part is however bare soil (wet sand, wet muddy sand, dry sand and water-saturated sediment) or covered with Vaucheria (Vaucheria sp.) or Microphytobenthos (MFB) (Figure 16).
In the zone upstream of the embanked polder (at transects DE and E) the slope is flat enough for sedimentation (<2.8%) and consequently progressive succession (marsh development) (Speybroeck et al. 2011). From East to West there is a gradient from low to high. At the lowest part the bare mudflat is colonised by Vaucheria (Vaucheria sp.), followed by Sea Aster (Aster tripolium) and Sea clubrush (scirpus maritimus) and in the end Common Reed (Phragmites australis) (Speybroeck et al. 2011).
The most upstream part (EF) is similar as zone ABC.
Avifauna: water birds and breeding birds
Water birdsIn total 46 water bird species were observed on Ketenisse during the monitoring period November 2002 and December 2006 (Van den Neucker et al. 2007). Number of bird days was used as unit for the bird monitoring. The number of bird days varied between 2500 and 12750 per month (2002-2006) (Figure 17) (Van den Neucker et al. 2007). The maximum of bird days was counted in June 2003 and June 2005, respectively due to the very high abundance of Common Shelduck and Lapwing (Van den Neucker et al. 2007). A positive trend was observed for the total number of bird days per season during the first three winter seasons (Figure 17).
The most numerous species were Common Shelduck (Tadorna tadorna), Greylag Goose (Anser anser), Pied Avocet (Recurvirostra avosetta) responsible for 31%, 18% and 9% of the total number of bird days and all of them are typical species for the mesohaline part of the estuary (Figure 18) (Van den Bergh 2005, Van den Neucker et al. 2007). On average, the largest number of birds was observed on the restored parts of zones D and E (KPd and KPe) (Figure 19) (Van den Neucker et al. 2007). Common Shelduck and Pied Avocet (Recurvirostra avosetta) feed on the more sheltered, low dynamic mudflats in KPd and KPe and breed on their highest parts. Greylag Goose feed on the Scirpus maritimus vegetation in these sections and rest on the mudflats. Lapwing (Vanellus vanellus), Gadwall (Anas strepera) and the migrating waders are more common on the sandier sections (kpa, kpb, kpc, kpf en kpg). Curlew (Numenius arquata) was found in all sections (Van den Bergh 2005). Overall, geese are typical winter guests, Common Shelduck and Pied Avocet are especially abundant in summer.
Breeding birds
The most abundant breeding birds on Ketenisse are some typical species for marsh habitat, like Common Redshank (Tringa tetanus) and Common Shelduck (Tadorna tadorna) (Van den Neucker et al. 2007). The Reed vegetation seemed a good breeding habitat for Eurasian Reed Warbler (Acrocephalus scirpaceus), Reed Bunting (Emberiza schoeniclus) and Bluethroat (Luscinia svecica). The Sigmadike is also used for breeding by Meadow Pipit (Anthus pratensis), Eurasian Skylark (Alauda arvensis) and Little Ringed Plover (Charadrius dubius).
The expansion of reed vegetation in the southern part of Ketenisse had led to the immediate colonisation by species such as Reed Bunting, Bluethroat, Eurasian Reed Warbler and Marsh Warbler (Acrocephalus palustris). This fast colonisation was probably also catalysed by the habitat loss at the inner side of the Sigmadike along the Ketenisroad.
During the period 2004 to 2006 remarkably less numbers of waders were observed to breed on Ketenisse. For Pied Avocet (Recurvirostra avosetta) and Little Ringed Plover (Charadrius dubius) this was possibly due to the advanced succession stadium of marsh vegetation. Only on the grass strip (not embanked zone LHT in the north of Ketenisse) and in the little polder between zone D and E, the number of waders remained stable. The number of waders decreased as a consequence of the development of large Reedbeds, in particular in the southern part.