

Disclaimer:
The authors are solely responsible for the content of this report. Material included herein does not represent the opinion of the European Community, and the European Community is not responsible for any use that might be made of it.
Back to overview measures
The UA - ECOBE group coordinates all research. The monitoring is part of the OMES-programme (to monitor environmental effects of Sigmaplan) when it concerns tidal characteristics, water and mass balances, basic water quality, heavy metals, sedimentation, geomorphological development of ditches, vegetation (incl. phytoplankton and -benthos), zooplankton, light climate, and primary production. Research of fauna (zoobenthos, birds, and fish) is conducted outside OMES.
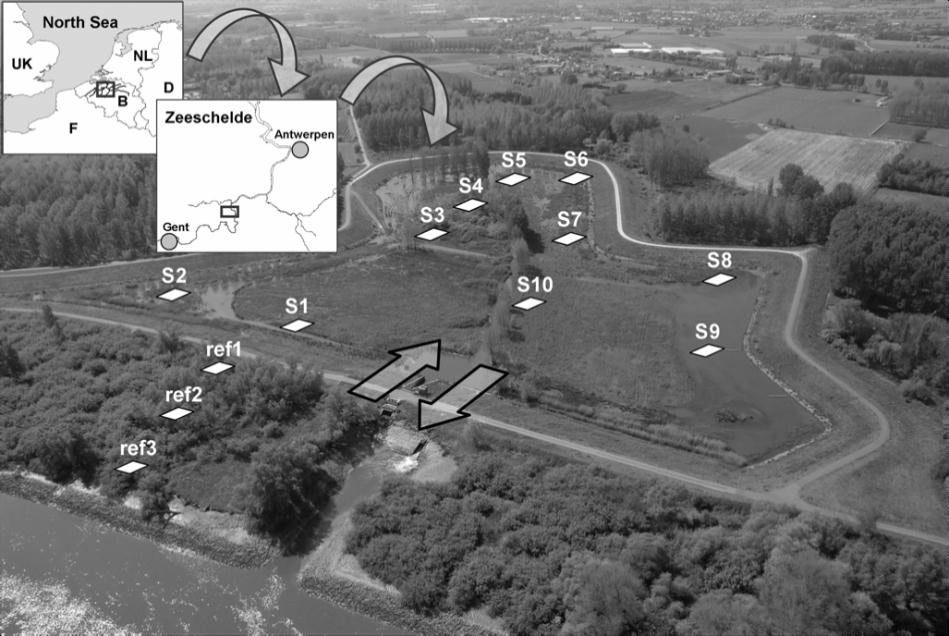
On ten randomly chosen monitoring sites, 9 plots (2 x 2m) for different sampling purposes are designated (Figure 8). This approach guarantees maximal comparability of different parameters, and minimises mutual interference of destructive and non-destructive measurement techniques. Vegetation, benthos, sedimentation and soil properties (e.g. compaction, granulometry, nutrients, and pollutants) are recorded in detail. At three reference sites on the adjacent marsh, the same parameters are being recorded (Figure 8).
Monitoring techniques:
Back to top
Lippenbroek: Flood Control Area with Controlled Reduced Tide (FCA-CRT)
Table of content
- 1. Description of measure
- 1a. Measure description
- 1b. Monitoring
- 1c. Monitoring results
- 2. Execution of main effectiveness criteria
- 2a. Effectiveness according to development targets of measure
- 2b. Impact on ecosystem services
- 2c. Degree of synergistic effects and conflicts according to uses
- 3. Additional evaluation criteria in view of EU environmental law
- 3a. Degree of synergistic effects and conflicts according to WFD aims
- 3b. Degree of synergistic effects and conflicts according to Natura 2000 aims
- 4. Crux of the matter
- 5. References
Additional information
for this measure:
No further information available.
for this measure:
No further information available.
Monitoring
The monitoring of Lippenbroek is still in progress. A large monitoring programme was installed to investigate whether sustainable ecological structures and functions can develop, that are quantitatively and qualitatively similar to these of the outer-dike mudflats and marshes. 9 research entities are working together within a joint spatial-temporal monitoring setup. The spatial-temporal monitoring was setup for processes (tidal cycling, nutrient processing (N, P, Si, O), and sedimentation) and structures (tidal marsh topography, -vegetation, and -fauna).The UA - ECOBE group coordinates all research. The monitoring is part of the OMES-programme (to monitor environmental effects of Sigmaplan) when it concerns tidal characteristics, water and mass balances, basic water quality, heavy metals, sedimentation, geomorphological development of ditches, vegetation (incl. phytoplankton and -benthos), zooplankton, light climate, and primary production. Research of fauna (zoobenthos, birds, and fish) is conducted outside OMES.
On ten randomly chosen monitoring sites, 9 plots (2 x 2m) for different sampling purposes are designated (Figure 8). This approach guarantees maximal comparability of different parameters, and minimises mutual interference of destructive and non-destructive measurement techniques. Vegetation, benthos, sedimentation and soil properties (e.g. compaction, granulometry, nutrients, and pollutants) are recorded in detail. At three reference sites on the adjacent marsh, the same parameters are being recorded (Figure 8).
Monitoring techniques:
- Spring-neap tide cycles
- Tidal characteristics are measured at each of the 10 sites and at the sluices. Diver dataloggers (Van Essen Instruments) monitor the water level by measuring the pressure of the water column with a pressure sensor. Correction for changes in air pressure is performed. From these water level records tidal characteristics are derived: absolute high (HW) and low water (LW) levels, inundation frequency (IF), inundation height and inundation time (for definitions see (Cox et al. 2006)).
- From May 2006 onward, water levels and flow velocities at the inlet and outlet sluices of the pilot CRT are monitored continuously on a 2 to 5-minute time interval. At distinguished moments (5 to 10 measurements campaigns for each in- and outlet sluice), discharge measurements were executed using portable measurement devices (e.g. Flo-MateTM and Qliner).
- Topography: Sedimentation / erosion, and creek formation
- At Lippenbroek several methods (at the 10 sample sites) are used for the sedimentation and erosion part of the monitoring program.
- Marker horizons are used to identify the thickness of disposed sediment on a clearly recognisable place.
- Surface elevation tables (SETs) measure very accurate (approximately 1 mm) the elevation changes of the sediment surface, both sedimentation and erosion.
- Sediment traps measure at specific locations the quantity of disposed sediment.
- Siphon samplers are positioned in the main channel to determine the suspended sediment concentration in the water column at inflow.
- Creek morphology is monitored using a total station (Sokkia, with accuracy of 1 to 3 mm).
- At Lippenbroek several methods (at the 10 sample sites) are used for the sedimentation and erosion part of the monitoring program.
- Water- and sediment quality
- Water quality analysis and exchange studies (nutrients, sediments, metals, biota (fish, algae)) were performed near the sluices during several separate 13 hour campaigns: water quality was monitored every half hour during the flood phase, every hour during the ebb phase. Subsurface samples were taken near the sluice by means of bucket hauls, stored at 4°C and analysed within 24 hours using a SKALAR SA 5100 colorimeter. Dissolved silica was analysed spectrophotometrically on a Thermo IRIS ICP (Inductively Coupled Plasmaspectrophotometer).
- Colonization fauna and flora
- Vegetation mapping
- monitoring of fish and birds